Hi everyone,
this is a lengthy one but I think it deserves some more information.
INTRODUCTION
I'd like to first and foremost state the following:
I understand that VMs are not officially supported and that idea exchange posts on how to setup your own Linux virtual machine are not an official source of information.
That being said, we experienced with just that and discovered that we hit a certain performance cap that evidently exists on cRIOs and PXIs as well.
SYSTEM DESCRIPTION
Our applications are large and could be described followingly:
1) It is not object oriented but consists of individual processes with wrappers for commands. These processes are governed by what we call an IOC (input-output controller) and we use QMH for communication.
2) Several IOCs can run on a single machine and they publish data using network streams to 'Developer GUIs' - lower level access.
3) All variables are stored in a local datastore (basically a Queue with one variant in it, keys are variant attributes to accomodate fast search).
4) Meaningful data are then sent using EPICS 3.14 server. Such a server is hosted in one of the IOCs which we describe as a ROOT IOC. PV variables are then used by 'EPICS GUIs' - higher level control and supervision.
5) We used to develop this for PharLap on RMC-8354 therefore such machine are called RMCs. RMC-8354 on NI page
6) As an example with our labels and terminology: RMC101 host two IOCs: ROOT IOC and Camera Manager IOC.
ISSUES
PharLaps frequently crashed (once a week) and RMC-8354 became a mature product with no viable rack-mount replacement. Therefore we started experimenting with VMs on either physical or cloud-based platform (vxRail). It became soon obvious that:
1) Linux can be easily managed and it is very stable.
2) Deployment is in fact easier than in case of a PharLap machine.
3) Our software cannot run as many IOCs as one would expect. We confirmed this on genuine NI hardware as well (PXI and cRIO with varying numbers of IOCs active).
Let me describe the behaviour:
Everything scales nicely until we exceed a certain CPU load. We know that CPU load data are reliable and thus it made no sense that it stopped increasing when we started adding more software on to the machine. During several months of experiments and various hacks we isolated the problem to scheduling. We managed to make a few traces and soon it became obvious that PharLap and Linux are very different beasts.
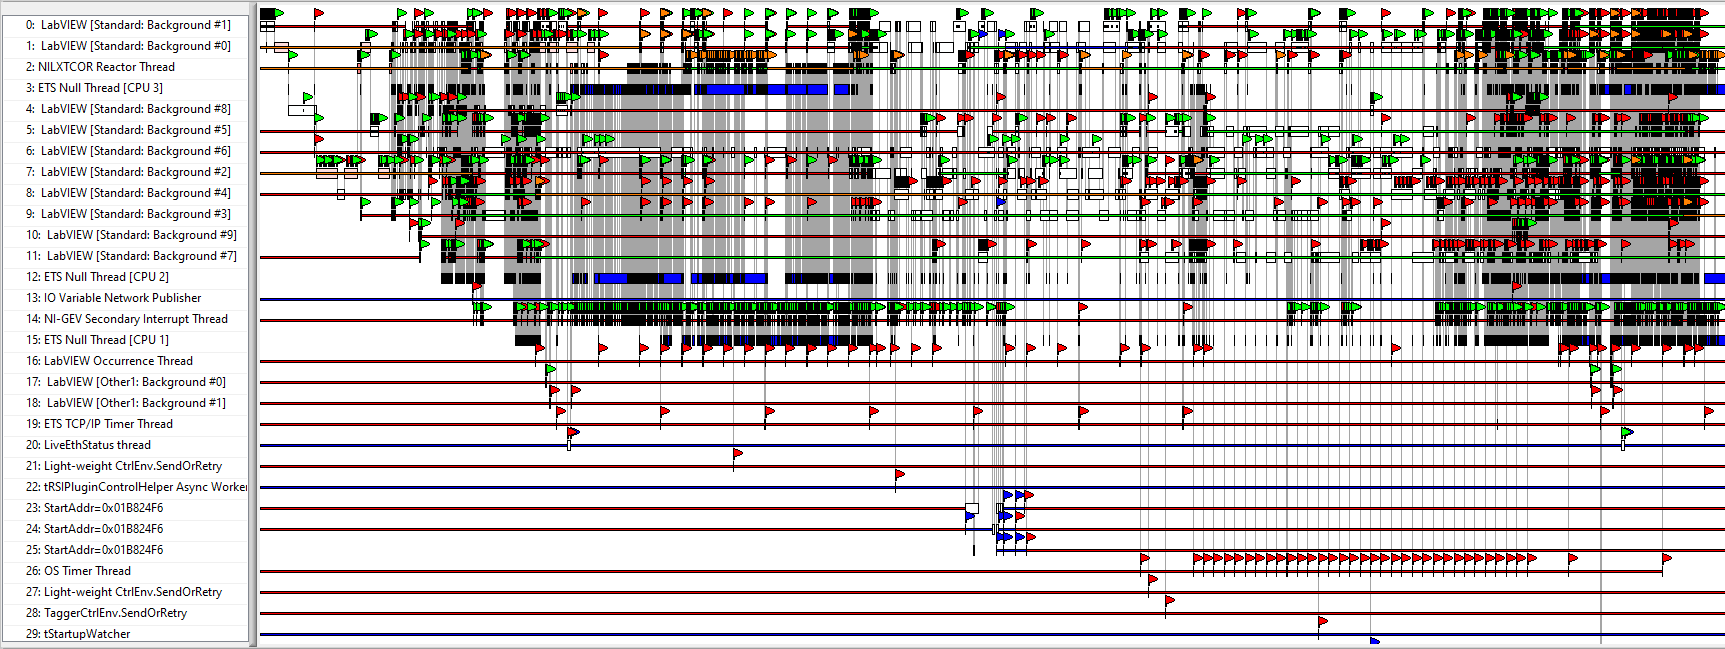
Pharlap trace is very organized and it manages to run 4-5 IOC with no problems (CPU is very high though, could be up to 95%).
A) PHARLAP TRACE
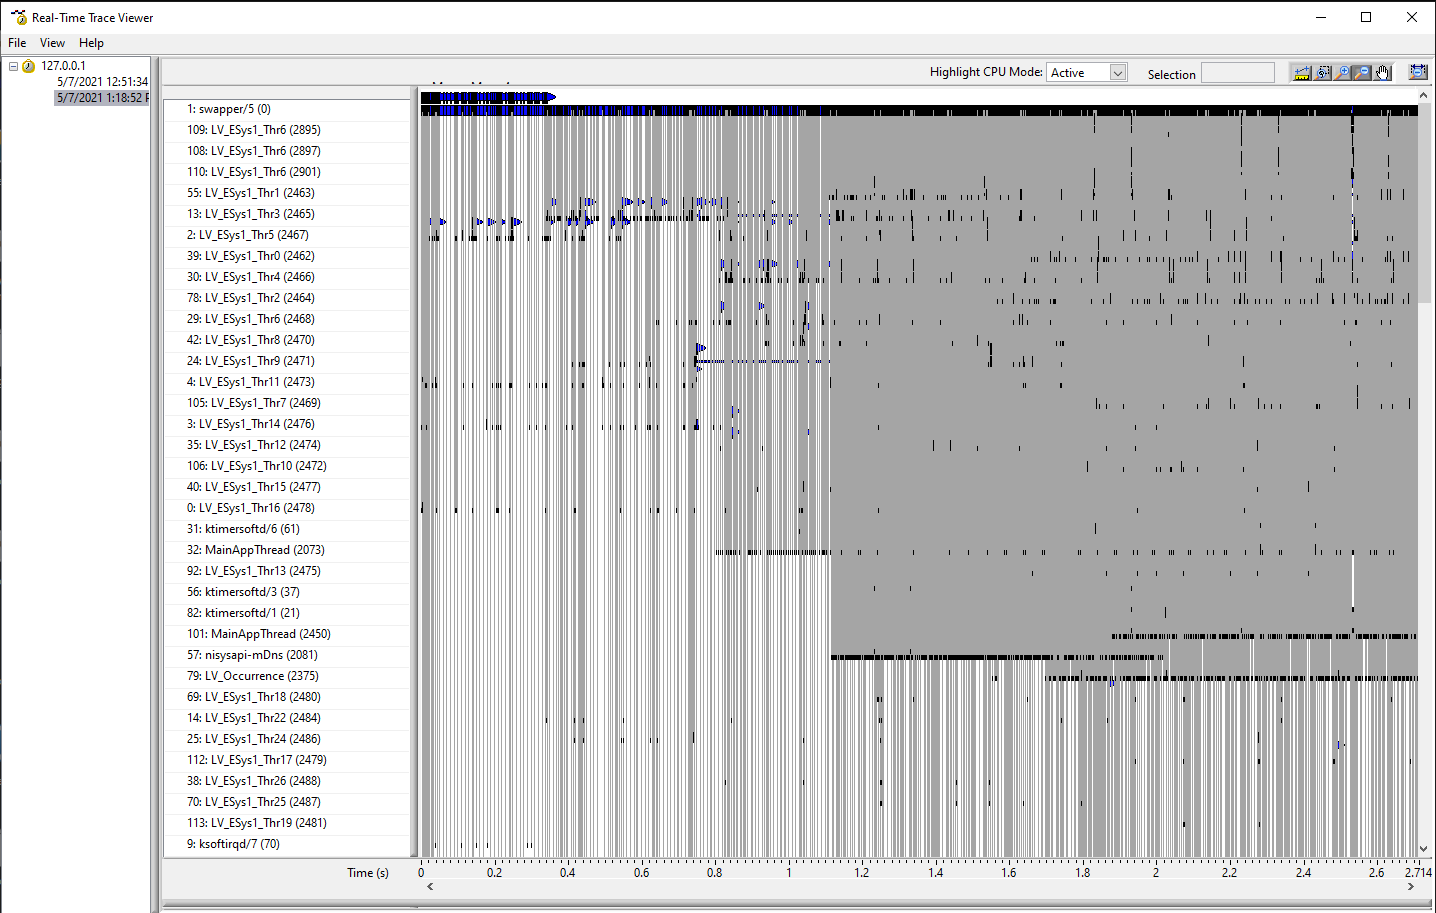
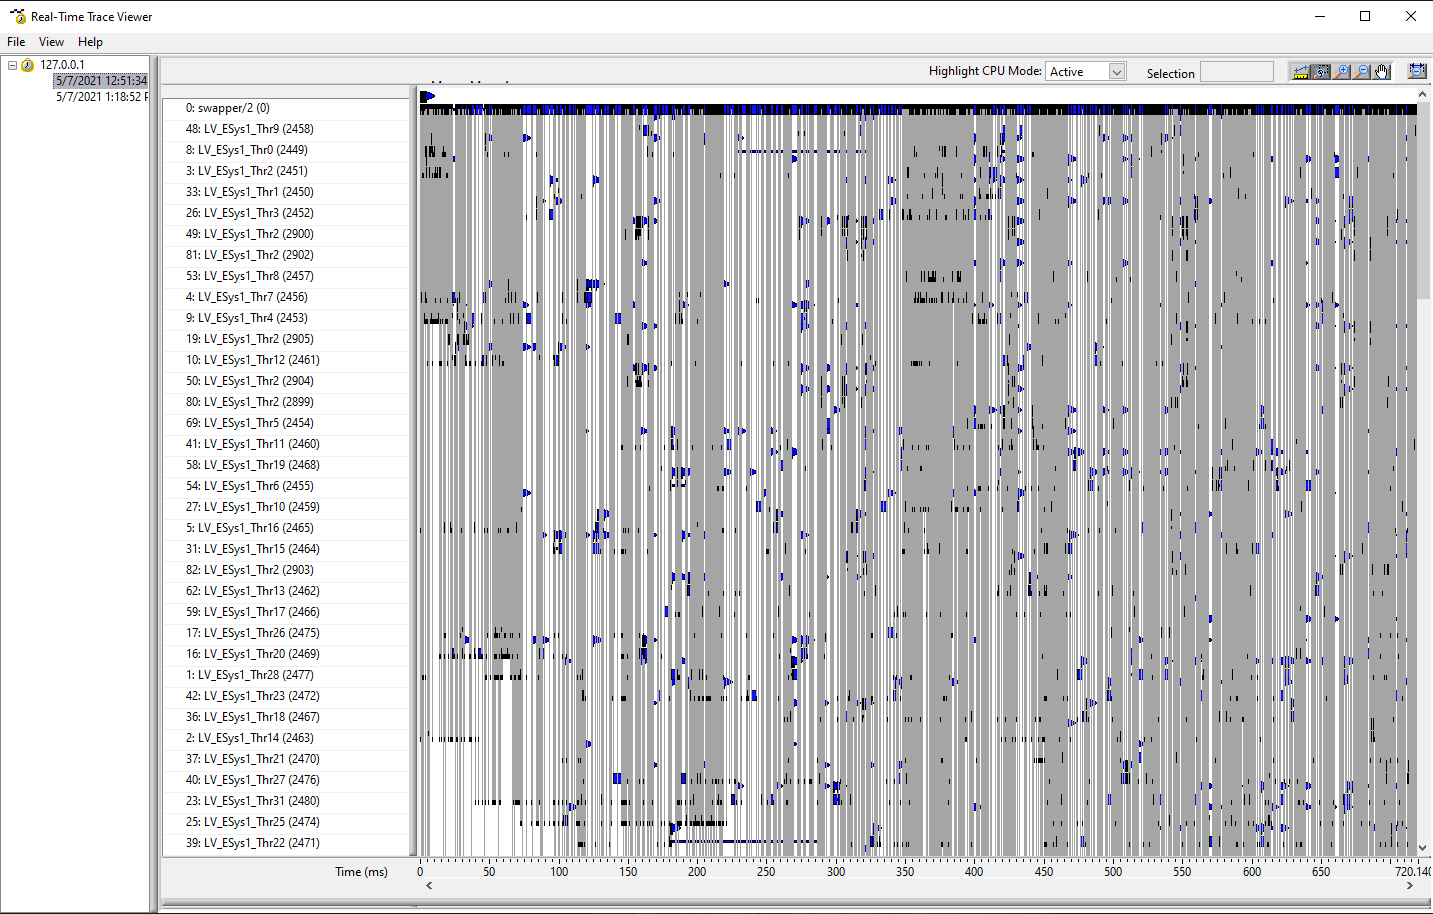
Linux on the other hand stops working when we add more than 2 IOCs and even 2 demanding IOCs can underperform.
B) LINUX TRACE WITH FUNCTIONAL CODE
C) LINUX TRACE WITH DYSFUNCTIONAL CODE
IN-DETAIL DESCRIPTION
Any increase in CPU load on a Linux machine causes more threads to be spawned and very high number of context switches is detected. So observing of CPU load does not help you because it is thread switching that becomes the issue. Why this happens is probably down to how compiler for Linux works and how it sets scheduling in NI Linux kernel.
We tested multiple things, including changes in scheduling strategies but these hacks are never stable and help only in specific arrangements of our IOCs. One such example is
pidof lvrt
2074
chrt -p -a -f 1 2074
This forces all threads to use FIFO scheduler with the lowest priority. Magically, this can improve performance - and then it crashes. CPU rises from 50 to 70% (since it can actually do more and it is not just swapping threads around).
I investigated threadconfig.vi and started experimenting with the number of threads being spawned. My latest discovery shows that by limiting the number of available threads per core in combination with increase in the number of available cores improves performance. I added these into lvrt.conf
ESys.Normal=10
ESys.StdNParallel=-1
ESys.Bgrnd=0
ESys.High=0
ESys.VHigh=10
ESys.TCritical=6
ESys.instrument.Bgrnd=0
ESys.instrument.Normal=0
ESys.instrument.High=0
ESys.instrument.VHigh=0
ESys.instrument.TCritical=0
ESys.DAQ.Bgrnd=0
ESys.DAQ.Normal=0
ESys.DAQ.High=0
ESys.DAQ.VHigh=0
ESys.DAQ.TCritical=0
ESys.other1.Bgrnd=0
ESys.other1.Normal=0
ESys.other1.High=0
ESys.other1.VHigh=0
ESys.other1.TCritical=0
ESys.other2.Bgrnd=0
ESys.other2.Normal=0
ESys.other2.High=0
ESys.other2.VHigh=0
ESys.other2.TCritical=0
I believe that the default number is 20 (threadconfig.vi somehow reported 26?) and we don't use other execution priorities so I limited standard threads to 10 per core. Also, if you completely omit time critical threads, it doesn't help in any way. Adding
ESys.TCritical=6
improved performance to the best it has ever been. I don't know why, we are not using time critical priority anyway, I searched the code with a script just to make sure.
One sure thing to improve it is going up with computational frequency - but that is not the latest trend and especially not in vmWare world.
COMPARISON WITH WIN10 BUILD
What makes me believe that this is not our fault? I admit that we are doing something very complex afterall. But the whole thing is not really using RT in any way and Windows 10 build of the same thing runs like a charm on much less powerful PCs.
SUMMARY
I am opened to any suggestions what to try next. Maybe you share the same experience?
The scariest thing for us is the fact that NI does not offer a follow-up to RMC that could perform as well as an 8-year-old PharLap machine.
We have contacted American NI team but the scale of the project does not help in explaining what is wrong. Their general response is - we will get back to you. While I understand that, we need to somehow move forward.
Thank you for any tips,
Petr


 Hi Lukasz, have you made any progress regarding this? I am investigating RT Linux vs Windows but I observe similar tropes. Might start a topic on the subject... Thanks, Petr