Jump to content

Search the Community

Showing results for tags 'bug 2011 graph'.

  • Search By Tags

    Type tags separated by commas.
  • Search By Author

Content Type


Forums

  • Software & Hardware Discussions
    • LabVIEW Community Edition
    • LabVIEW General
    • LabVIEW (By Category)
    • Hardware
  • Resources
    • LabVIEW Getting Started
    • GCentral
    • Code Repository (Certified)
    • LAVA Code on LabVIEW Tools Network
    • Code In-Development
    • OpenG
  • Community
    • LAVA Lounge
    • LabVIEW Feedback for NI
    • LabVIEW Ecosystem
  • LAVA Site Related
    • Site Feedback & Support
    • Wiki Help

Categories

  • *Uncertified*
  • LabVIEW Tools Network Certified
  • LabVIEW API
    • VI Scripting
    • JKI Right-Click Framework Plugins
    • Quick Drop Plugins
    • XNodes
  • General
  • User Interface
    • X-Controls
  • LabVIEW IDE
    • Custom Probes
  • LabVIEW OOP
  • Database & File IO
  • Machine Vision & Imaging
  • Remote Control, Monitoring and the Internet
  • Hardware

Find results in...

Find results that contain...


Date Created

  • Start

    End


Last Updated

  • Start

    End


Filter by number of...

Joined

  • Start

    End


Group


Personal Website


Company Website


Twitter Name


LinkedIn Profile


Facebook Page


Location


Interests

Found 1 result

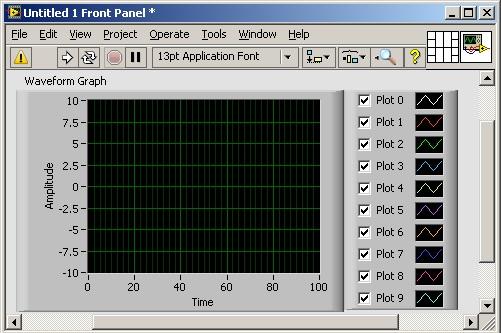
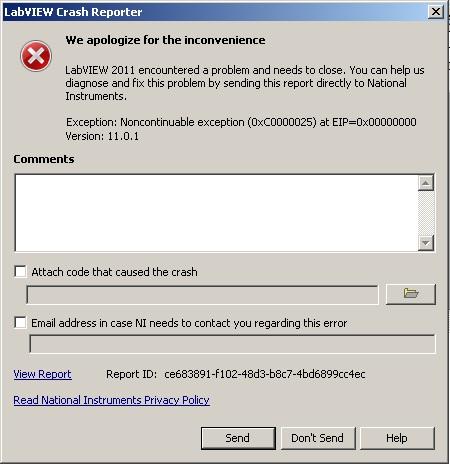
  1. It looks like a new feature was added that allows you to select which data sets are to be displayed on a graph. I have manually done this with many of my programs and saw this was going to be a real time saver. If you enable autoscale Y and switch between data sets, the autoscale does not work. You have to add a property to detect the change and then force a refresh. Still it's cleaner than what I was doing, but wish it fully worked. To enable this feature, just right click on the label and make it visible. Also noticed that if I dynamically change the labels on a digital graph using properties, that these do not get updated until I stop the program or drag it off the screen. The only work around I found was to turn off the graph then turn it back on. You can reproduce this problem without coding anything. Beware if you try and play with the digital graph properties that you save your work first. You may get something like this:
×
×
  • Create New...

Important Information

By using this site, you agree to our Terms of Use.