Search the Community
Showing results for tags 'dsp'.
Found 3 results
-
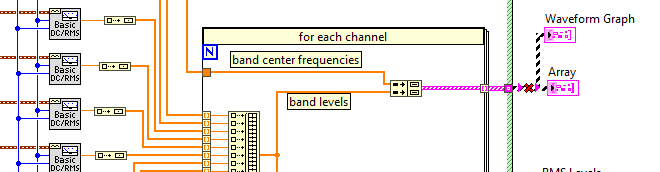
Hello, I am working on code that will read a waveform of a sound pressure measurement and calculate the octave band levels. I would be incredibly grateful if someone could take a glance at my code to see what I have wired incorrectly... The issue I think I'm having: The output of the "Basic Averaged DC-RMS" output wont index when I put it into the for loop. I tried to get around this problem by building arrays for each RMS output and then indexing into the for loop. Doing this doesn't allow me to graph the output... Any ideas as to why the "Basic Averaged DC-RMS" wont index directly? The code (inspired by new NXG example) is attached, both VI's must be downloaded in order to run the "Octave Band Levels" VI. Also, I'm aware that LV has a toolkit for sound analysis & octave band analysis... but I do not have access to this toolkit, which is why i'm trying to write my own VI. Thanks in advance! Octave Band Levels.vi Waveform Butterworth Filter.vi

-
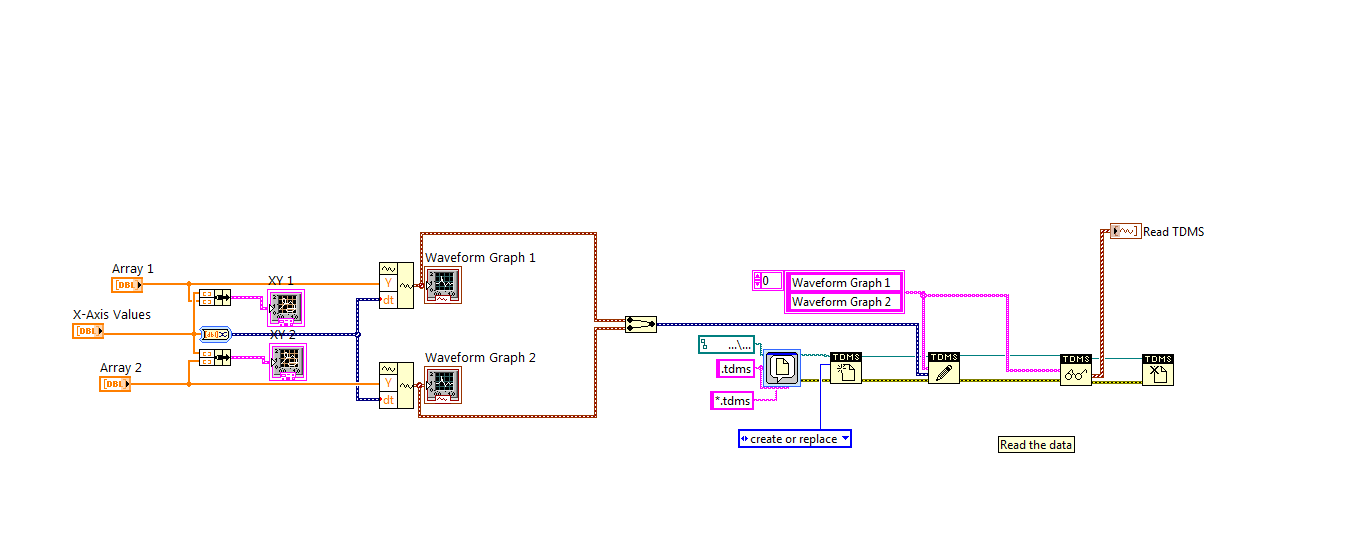
Hello I am trying to save TDMS files that ideally contain the following: - 3 xy graphs (each containing two 1d arrays) - 1 waveform The problem i'm running into is that when I convert the xy graphs to waveforms, the x-axis is converted to time, which isn't real or useful to me. I've attached screenshots of what the XY graph should look like VS what it ends up looking like with the waveform. How to I make sure the x-axis is preserved so that I can save to TDMS? Edit: VI is included & pictures have been updated to better represent my code. TDMS Waveform Example.vi
-
I have been using a Developers Suite for quite some time and have found some of the VI's in the signal processing tool kit very helpful. I am not involved in video processing at this point; lots of underwater acoustics. There are many VI's I have not used and there are limited examples in many cases. I have not found current resources that discuss DSP applications for most of the Vi's. What resorces are available? Thanks. pat