Search the Community
Showing results for tags 'performance monitor'.
-
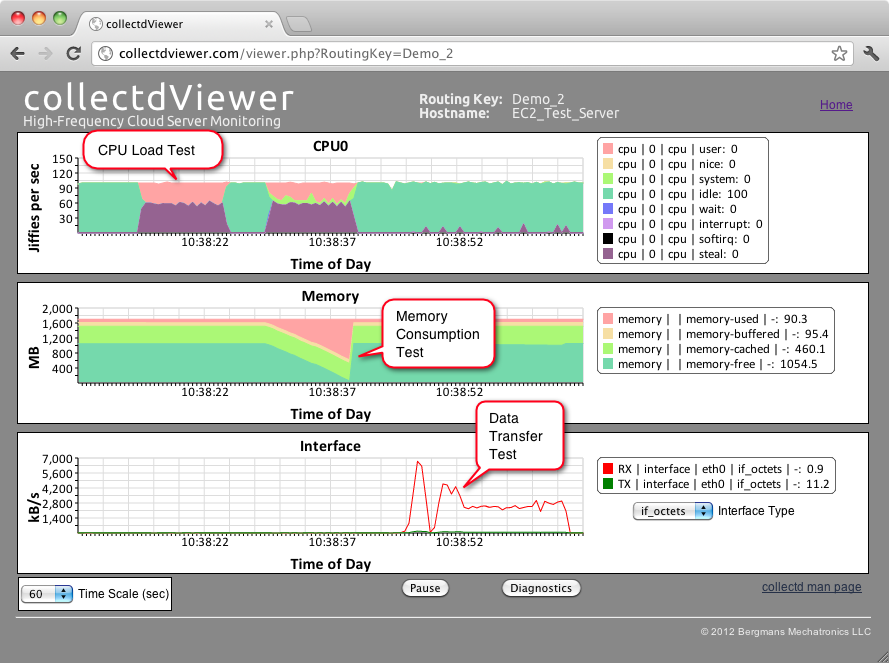
Hello LAVA. Here's an idea for those interested in browser-based monitoring of cRIO-9068 performance. A few years ago I developed the collectdViewer system as a demonstration to the "DevOps" community of the benefits of using WebSockets for server monitoring. Operation of the system is quite simple conceptually: The system uses a collectd daemon (http://collectd.org) to monitor the performance parameters (eg CPU, memory, network activity) of a Linux platform. This performance data is then sent via a message broker and a WebSocket connection to a browser for display. The WebSocket connection to the browser enables a display update rate of 2x per second and as a result, it's possible to observe short transient phenomenon in the behavior of a server. For example, attached is a screenshot of collectdViewer monitoring the performance of an EC2 instance during various system load tests in a 60 second period. The high update rate also make it possible to observe phenomenon such as the network activity associated with serving a single web page or the CPU usage of the login process. Since the cRIO-9068 uses NI's Real-Time Linux operating system, it seems that it should be possible to use collectdViewer for browser-based monitoring of this platform as well. If you'd like to try the system yourself for this application, more information and a downloadable demo are available at: http://collectdviewer.com. Let me know if you need help with setting up the demo system to monitor the performance of your cRIO-9068. A few of other notes: 1) The downloadable demo of the system at the above link uses a message broker hosted on my cloud server. If there's interest in using this system for autonomously monitoring your cRIO-9068, I can create completely standalone systems for a modest fee. These systems would include a Virtual Machine that hosts an HTTP server and message broker and can run on a PC, Mac or Linux platform within your LAN. 2) The video at the following link shows the use of collectdviewer for monitoring and studying the transfer of data from the (recently defunct) Nirvanix Internet File System to an EC2 Server: http://collectdviewer.com/applications.html#monitoring_cloud_storage_data_transfer. 3) It would be feasible to incorporate the display of values of LabVIEW variables in the collectdViewer plots. One way to do this would be to use the STOMP library that I developed for the LabSocket system to send LabVIEW data to the message broker of the collectdViewer system. This idea is somewhat half-baked at this stage, but I thought I'd put it out there in case anyone had an interest in it. Any thoughts or comments are welcome. PS - Apologies for not including live hyperlinks in this post. It appears that the forum editor software is blocking these links for some reason. -John jbergmans // at bergmans // dot com
- 4 replies
-
- performance monitor
- browser
-
(and 1 more)
Tagged with:


