Leaderboard


Popular Content
Showing content with the highest reputation on 08/21/2013 in all areas
-
I suggest you all start using the new Event Inspector Window. On the left-most column you'll see a sequence#. This is a globally unique number that each event has and is used to order the events. This is a new (behind the scenes) feature of LabVIEW 2013 that guarantees that events now will always be handled in the order they are fired.1 point
-
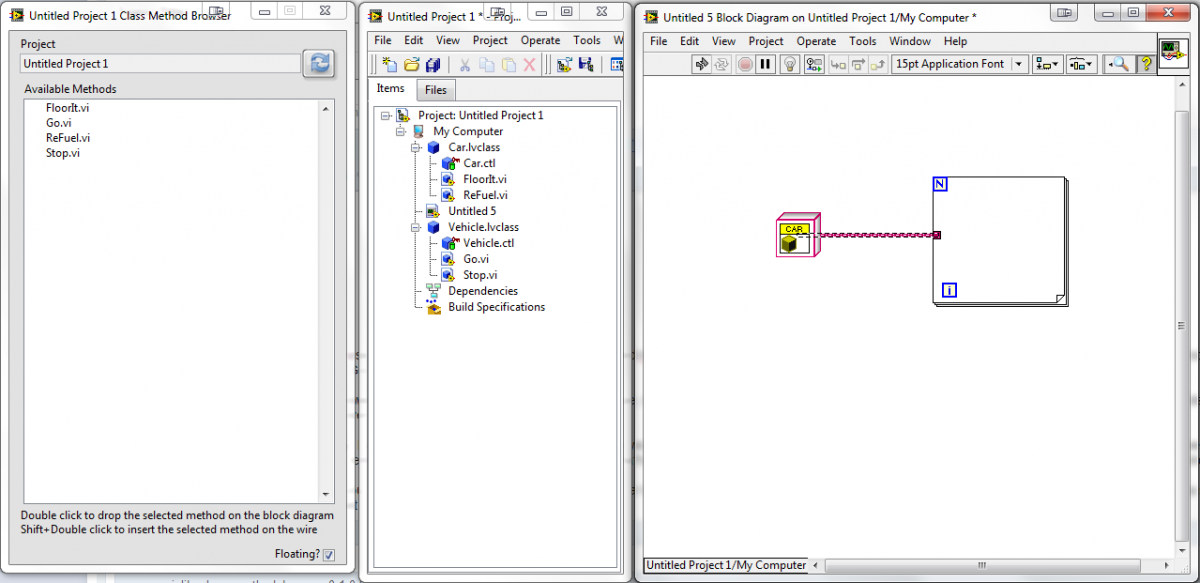
NOTE: THIS TOOL WILL CURRENTLY CRASH LABVIEW Checkout this pseudo code: Class Vehicle{ Public Methods: Go(), Stop() } Class Car inherits Vehicle{ Public Methods: FloorIt(), ReFuel() } In school, I programmed java with Eclipse. In Eclipse, when you have a variable named myCar with a type "Car" you could type: myCar. (notice the period). When you typed the period, eclipse would pop up a little dropdown with the following in it: Go(), Stop(), FloorIt(), ReFuel(). These are all the methods that i'm allowed to call on the myCar variable. It's a car type, so I cal call all the Car methods, but a car IS A vehicle, so I can also call all the vehicle methods on it. Eclipse would figure this all out for me, and just show me everything. I wanted something like this in labview. I always found it a pain to look at the class I'm working on, then have to find it's parent in the project and find all the methods of it that i'm allowed to call, then go up another layer perhaps. Additionally, I need to remember access scope. So if I have class A that's calling a method on class B, what is it allowed to call? It depends on if the classes are parent/children, or if they're friends. I made a tool that does all of this for you. All you have to do is click on a class wire in a VI, and the tool creates a list of all VIs that you're allowed to call on that wire. It looks at access scope and it traverses the class hierarchy. And it does all this fast. (notice the car wire has been selected, and the Class method browser shows all the methods that it can call) Double clicking on a method name in the method browser will place the VI on your mouse so that you can drop it on the block diagram wherever. Shift double clicking on the method name will insert it on the currently selected wire (using a very bad insert algorithm). Hovering over a class name will show the method's description in the context help. HOW THIS TOOL WILL CRASH LABVIEW I wanted this to be fast. I didn't want there to be a wait every time you selected a new thing on the block diagram. Unfortunately, all of what I'm doing involve VI server calls, which are not super fast. The main culprit is when figuring out what the parent of the class is. So to avoid these slow VI server calls, I cache everything I will need. I make the slow calls once when you boot up the tool, and then every other time I need the info, i just have to look it up in a variant database. Perfect, and blazing fast. Well somewhere along the lines LabVIEW complains. Basically, if open the tool, then change a classes private data, LabVIEW will crash. I've submitted this to NI, but all I've heard back is "This is in CAR....." I wish this didn't happen. If it didn't then I would've spent some more time polishing this up, and then proudly released the tool (with lot of money, fame, cars and houses to follow). But it was not meant to be. So i post it here. In hopes that someone gives me an idea of how to avoid the crash. Or maybe you'll just tell me it's a dumb idea. mgi_lib_class_method_browser-0.1.0.2.vip
 1 point