Leaderboard


Popular Content
Showing content with the highest reputation on 05/07/2012 in all areas
-
If you don't always want to debug, add a context menu item or an off-panel button with a hotkey set. Bury your breakpoint in the event handler of that object, and tada! On-demand block diagram!2 points
-
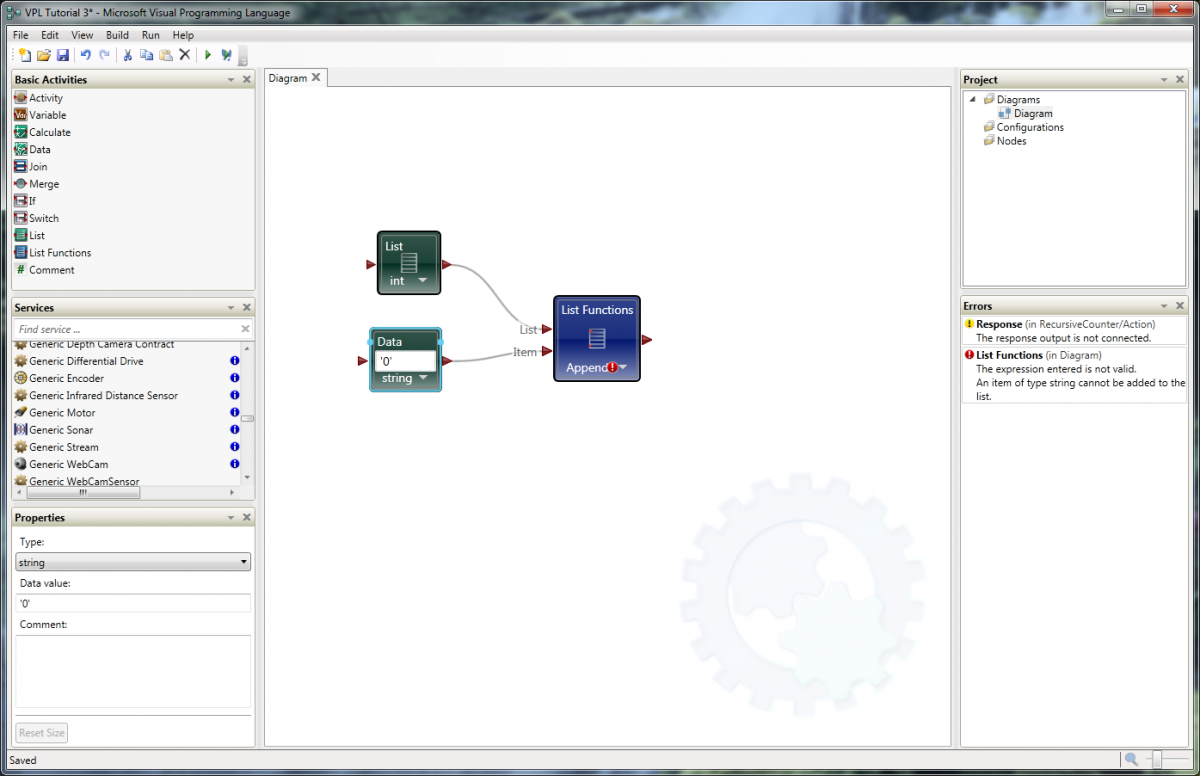
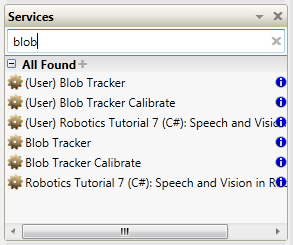
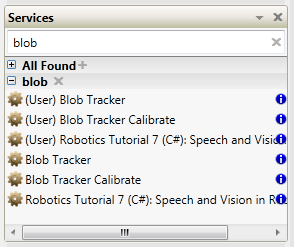
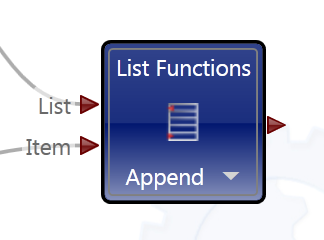
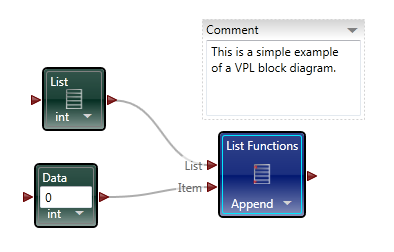
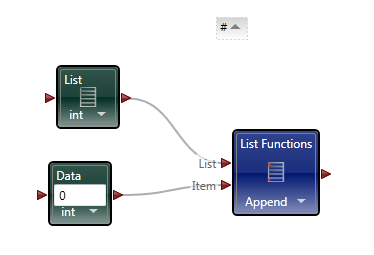
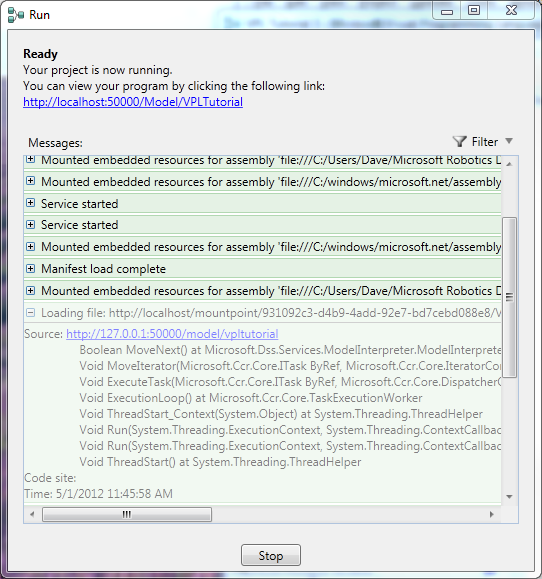
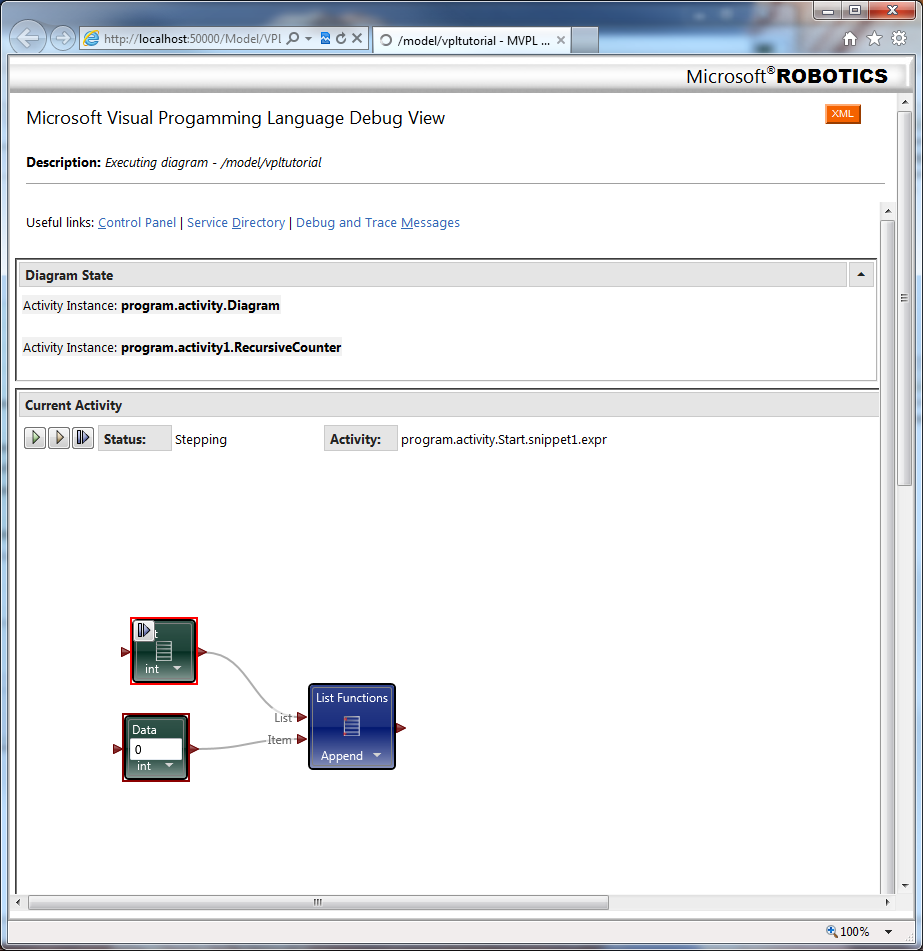
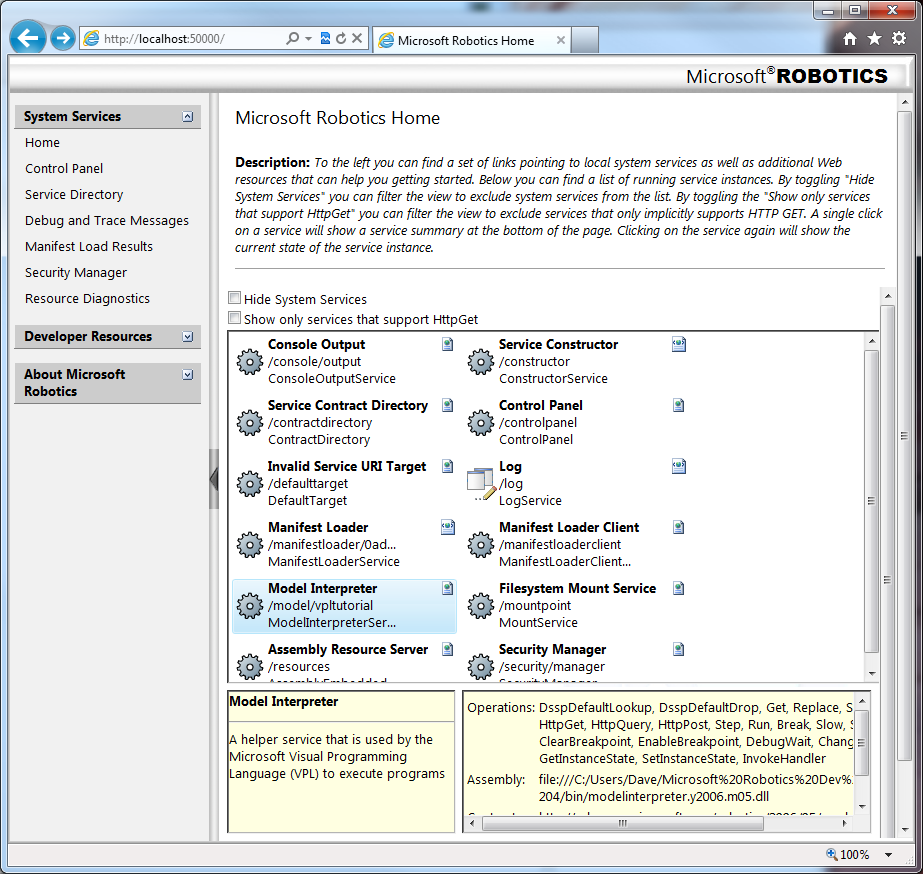
Recently I've been looking around at other dataflow languages, primarily because I'm curious to see how G's language design influences the way we think about dataflow. Last week I downloaded and installed Microsoft's Visual Programming Language, a dataflow language included as part of their Robotics Development Studio. On the surface VPL appears to be a direct competitor to Labview. If that concerns you, don't worry... imo VPL has a long ways to go before it can offer the simple workflow and overall ease of use as Labview. In fact, when Robotic Studio was first released MS did not publicly consider it a competitor to Labview. Still, it has interesting features that may (or may not) be useful in a Labview context. This post is not intended to be a criticism of Labview or question NI's design decisions surrounding the language and IDE. It's just pointing out a few of the differences and my reaction to them. The IDE The very first thing to notice is the MDI (multi-document interface -- docked windows) IDE. In my opinion Microsoft does a very good job creating developer-friendly IDEs. The VPL IDE, though sparse, has the look and feel many text language developers are used to. Although we've learned to accept it, Labview's window management can be a pain sometimes and it was refreshing to work in an environment where that wasn't a concern. The Basic Activities and Services palettes contain all the components I can use on the block diagram. The Project and Errors window are always visible, making it more convenient for me to use those features. The project window doesn't contain all the information I would expect it to and in fact some parts of my project can be difficult to get to. In particular, in this project I have a custom activity--roughly analagous to a LV sub vi--and the only way I've been able to get to that block diagram is through the error window. I can't say whether this is an oversight in the IDE design or me not fully understanding the programming model. In the diagram above I'm trying to add a string to an integer list, which is a type mismatch error. Selecting the List Functions error from the error list causes the corresponding error icon to throb, drawing the developer's attention to it. Does VPL's error highlighting provide better usability than LV's error highlighting? Not really, but having worked in LV's visually static environment for so long there was a certain amount of juvenile delight in seeing dynamic graphics on the block diagram. The Properties window shows the properties of the selected block diagram item. I'd love to have a similar feature in LV. LV's modal properties dialog box feels antiquated and clunky in comparison. To be fair, a sub vi has far more properties than any of the VPL nodes I used, so presenting all that information to the user is not a trivial challenge. The Services palette offers a search box, similar to LV's palette search, but extends it in an interesting and useful way. It is possible to save the search results in a custom palette group. For example, if I type in 'blob' the palette shows all the related services. Clicking on the '+' symbol creates a new grouping named 'blob,' making it very easy for me to locate commonly used palette items. I expect groups would be created and destroyed frequently during a development session. Also noteworthy is the blue information icons on the palette. Clicking on the icon opens the help associated help page in a browser. It seems insignificant, but it is more natural than LV's process of hovering over the sub vi and mousing over to the context help window to click the link. For reasons I'll explain later, in VPL visible pin labels are more important to readability than they are in LV. I like how MS has made them less obtrusive. The label is translucent, not transparent. Wires passing under a label are dimmed somewhat instead of completely obscured, preserving the visual connection while retaining readability. I've often wished for better transparency support in LV. VPL includes comment blocks, which are similar to free labels. Comment blocks have the added features of being collapsable and having scrollbars when they are needed. These are features I'd love to see ported to Labview. Oddly, comment blocks do not offer a word wrap option, something they would definitely benefit from. The IDE also offers something many LV users have lobbied for and equally many LV users have lobbied against: block diagram zoom. Insert religious war here. Debugging Running a program from the dev environment gives us some insight into what is going on under the hood with VPL. A dialog box opens telling me my project is running with a list of messages. As you can see from the image below, even simple programs have some pretty significant stuff behind them. If your program isn't behaving as expected, errors will show up here. In typical Microsoft fashion, there is an abundance of cryptic information to sift through. While perhaps intimidating for new users, I'm certain it would be very useful in the hands of experienced developers. I haven't decided if I like VPL's debugging features or not. It's very different from anything I've used in the past. For starters, the debug environment is presented in a browser window. Current Activity highlights the next step to execute in the block diagram and provides controls for single steps, running, and setting break points (not shown), but the block diagram is just an image; there's no interactivity with any of the elements. You cannot probe a wire to see what value was sent. VPL offers a "Log" service you need to add to the block diagram instead. One nice thing LV does that VPL does not is execution highlighting. In VPL's debugging view the execution jumps from node to node. The ommission makes it harder to follow the data flow--especially for LV developers--because VPL's concept of dataflow on the block diagram is very different from LV's interpretation. (More on this later.) In these ways VPL's debugging features feel very primitive compared to those available in LV. On the other hand, near the top of the debug window are links to the control panel. I haven't used VPL enough to understand how useful it is in a real application. In general I prefer too much information over not enough, and the control panel contains a lot of information. There are certainly times I've wanted more visibility into LV's inner workings to help troubleshoot a problem. I didn't even get to the parts I really wanted to talk about--activities, merge nodes, notifier pins, and the differences in data flow models. I'll post a followup covering those topics in the near future.
 1 point
 -
Too many donuts is part of the problem... At least in the US. Also, too many people in the world. With limited resources (energy, water, clean air, a place to dump our trash), we will always be on a course to destruction until we all learn to limit our population to a sustainable level. If we don't, someday the planet will do it for us. (famine, disease, etc...) But, on a more positive note and back to the original topic, I hope this means I won't need a sweater when attending NI Week this year! -John1 point
-
Interesting comments about messaging. I wonder if NI would ever consider extending dataflow to include 'messageflow'. Perhaps adding another layer on top of LabVIEW to define the flow of messages between actors? Something along the lines of the state-chart add-on? Since there is a push to mainstream the actor framework, this might be on the long term roadmap.1 point
-
That's fairly common in the pacific northwest area. I assumed it was a nation-wide trend. I take it your neck of the woods is different? Anyhoo, the one immutable and unrevokable law regarding any public policy is the law of unintended consequences. What sounds like a good idea today will be identified as the root cause of some crisis 20 years from now. When I was a kid catalytic converters were going to save the world from the terrible evil of automobile pollution. All the bad stuff coming out of the exhaust pipe will be replaced by natural and harmless elements: oxygen, water, and carbon dioxide. 35 years later we're told automobiles are one of the primary sources of greenhouse gases. So much for harmless... Don't get me wrong, I think it's good to be concerned about the environment and do our best to avoid negatively impacting it. At the same time, I think green technologies and promises of environmental friendliness are oversold to the public. Human civilization requires more resources every year. There's no way to extract those resources from the planetary system and deliver them to where they are needed without impacting the environment. *shrug* What can be bad about separating trash, biodegradables, and recyclables? I don't really know. I suppose having 3 trucks pick up the waste instead of 1 adds a certain amount of pollution to the air. Purchasing and maintaining extra trucks and employing additional drivers adds cost to the collection service, which in turn is passed on to consumer. Maybe the extra disposal trucks add to traffic congestion, keeping everyone on the road longer and multiplying the pollution effect. Maybe these are real effects, maybe they aren't. But I'll lay dollars to donuts there is some crisis lurking in the shadows waiting to attack our collective conscience in a couple decades.1 point
-
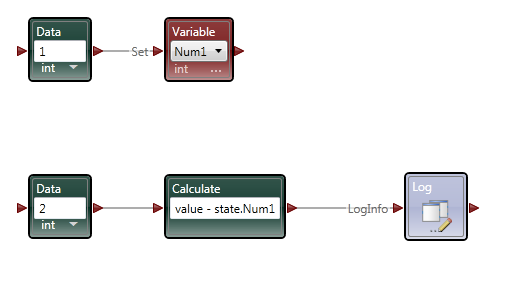
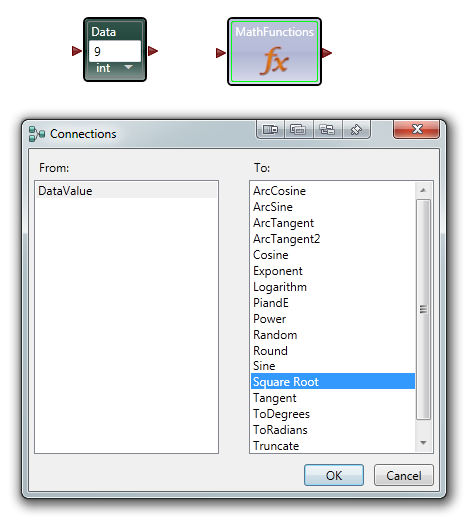
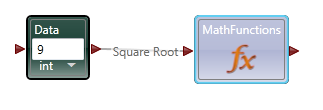
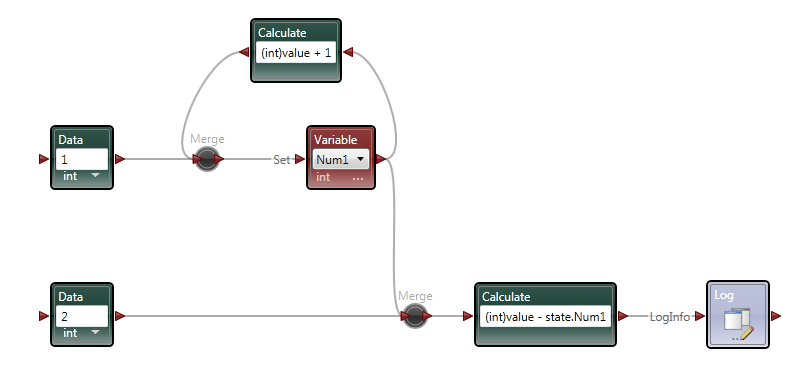
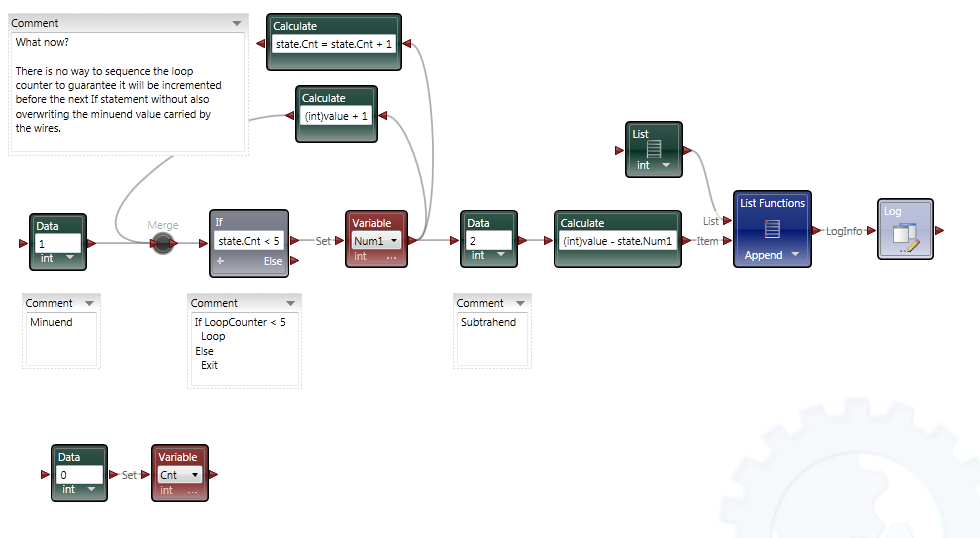
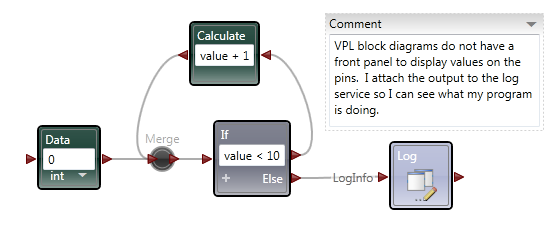
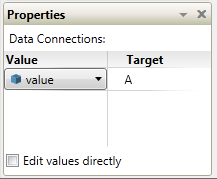
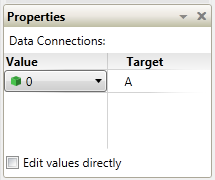
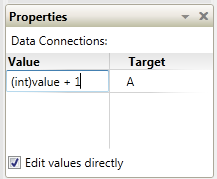
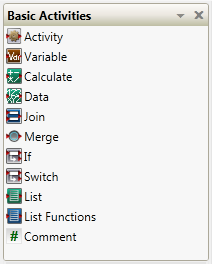
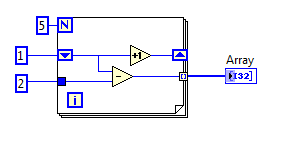
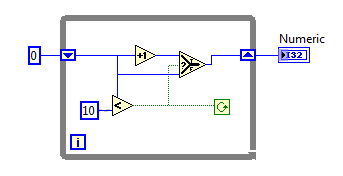
Part 2 In the first post I focused the IDE and few things NI might consider implementing in Labview to make our lives easier. In part 2 I’ll compare a few ways VPL code differs from Labview code and illustrate why it seems all wrong to a Labview developer. At the end of part 2 I’ll show why, despite all the apparent flaws in VPL, it actually makes a lot of sense. Show me something simple On the surface VPL and Labview look very similar, but if you try reading a VPL block diagram using Labview’s data flow model, you’ll quickly discover it doesn’t make any sense. In fact, it turns out simple tasks in Labview can be quite hard to accomplish in VPL. Let’s take a look at an incremental looping routine. In pseudocode, I might write something like this: int i = 0 while i < 10 i = i + 1 wend [/CODE] One functionally equivalent G implementation is, We know NI has patented the rectangle, which means other graphical data flow languages need to develop another way to describe the same semantics. A VPL while loop looks like this. [u][i]Hold up. What’s a “Merge” node?[/i][/u] Interpreting the VPL code from a Labview mindset leads us to believe the program is faulty. There is a circular data dependency. It appears we have a deadlock at the Merge node. Looking closer, we can see there are inputs from [i]two[/i] source terminals connected to a [i]single[/i] destination terminal on the Merge node. Labview doesn’t allow that—every destination terminal can have at most a single source terminal. What’s going on here? VPL enforces the same rule of a maximum of one source for each destination pin, [i]except[/i] with the Merge node. The Merge input pin is the one pin that accepts multiple sources. Its function is to simply pass on all the data it receives as soon as it receives it. It seems very peculiar at first, but without the ability to merge multiple data sources into one, loops like this would not be possible. From a certain point of view, Labview’s shift registers do exactly the same thing; they accept the initial value from a source outside the loop, then the same shift register later accepts values from sources inside the loop. The main differences are: 1) Labview’s patented rectangles provide a clear delineation between what is inside the loop and what is outside the loop, and 2) in Labview the wire showing the return path is hidden from users. [u][i]Why does “If” have two output pins?[/i][/u] Here’s a question for you: Looking at the above VPL diagram, how many times does the Log node execute? The ‘If’ node will execute 11 times total (i=0 through 10, inclusive) so according to Labview’s data flow model we expect the Log node to execute 11 times. That would be wrong. Data is sent to the Log node only once, when i=10. This illustrates a key difference in VPL’s handling of data flow with respect to nodes. In LV, [i]none[/i] of the data exits a given node—sub vi, case structure, loop, etc.—until [i]all[/i] of the output nodes have data. That’s not true in VPL. When data becomes available on one output pin, other output pins may or may not also have data available. In the case of the ‘If’ node, the text shows us the conditions under which each output pin will have data. If i < 10, the top pin will have data; otherwise the bottom pin will have data. Last year Steve Chandler started a discussion on LAVA questioning whether or not Lavbiew is a “pure” dataflow language. The conversation touched a bit on the behavior of output terminals on nodes. NI’s approach in Labview makes it much easier to develop and reason about a program. Microsoft’s implementation in VPL is arguably a purer interpretation of dataflow. [u][i]I’ve only seen a handful of nodes. Show me the core functionality.[/i][/u] We are all aware of Labview’s rich set of basic functions. There are so many built-in nodes on more than one occasion I have created my own sub vi to do something only to discover later the same functionality is already included in a native node. By comparison, VPL’s basic functions appear wholly inadequate. There are a total of 11—yes, 11—nodes that define the native operations in VPL. (VPL does have a respectable set of advanced features available from the services palette, but they are not core parts of the language.) Something as simple as subtracting two numbers requires excruciatingly unnatural code. [u][i]What do you mean? Subtracting is hard?[/i][/u] Almost all nodes, including the Calculate node, are restricted to one input pin, so the second number has to be made available to the calculation by other means. In this code I have created a variable named “Num1” and assigned it the value of 1. I’ve also created a data constant with the value of 2 and connected it to the Calculate input pin. The statement inside the Calculate node shows the calculation that will be done. “Value” refers to the value received on the input pin. “State.Num1” refers to the value in the Num1 variable I created. VPL variables are analogous to Labview local variables, except VPL variables are not tied to a front panel control; they are available via the “state” object. Compared to the simple code required to subtract two numbers in Labview, the VPL code almost appears purposely obfuscated. To take it a step further, suppose I want to subtract two numbers multiple times while incrementing the minuend (the number being subtracted from.) In Labview it is easy. I spent about 20 minutes trying to figure out how to do the same thing in VPL. My first implementation doesn’t work. In this code I tried to retrigger the Calculate node by linking the Variable.Set node to the Calculate node’s input pin. The idea is every time the variable is incremented and set the calculation will be performed again. A little thought reveals why this doesn’t work. Since the wires attached to the variable output pin carry the value contained in state.Num1, the calculation will always be equal to zero. After trying a few different things, I’m not sure the code [i]can[/i] be written in VPL without adding a lot of complexity. The diagram below is as close as I could get in the amount of time I was willing to spend on it. The minuend and the loop counter variables are completely independent—there’s no way force both operations to complete before sending the modified minuend on to the next node without overwriting loop counter. [i](Note: While playing around in VPL some more after finishing the writeup, I discovered a way to force the loop counter and minuend to be updated before executing the If node again. I didn't really feel like going back and rewriting this section, but if there's [s]enough[/s] any interest I'll post a block diagram showing the code.)[/i] [u][i]That’s some weird behavior for a sub vi[/i][/u] There are other things an experienced LV user may struggle with when using VPL. We primarily think of nodes in terms of sub vis with each function represented by a different sub vi. Most VPL nodes, especially the advanced nodes, behave more like a polymorphic sub vi. Instead of selecting the function and dropping the correct node, in VPL you drop the node first and select the function to be performed. In VPL the function is chosen via dialog box when attaching a wire. In the diagram below I want to find the square root of 9. When I attach the wire, the dialog box appears asking me to define the math function I want to use. After choosing the function, the diagram shows the nodes connected with the function represented by the pin label. (In part 1 I commented on pin labels being more important in VPL than in Labview. This is why I said that—without the pin label we’d have no way of identifying which function was being performed.) Wires in general play a more active role in VPL than the passive data carriers they are in Labview. Since nearly all VPL nodes are restricted to a single input pin, the wire—not the node—defines which node outputs and node inputs are selected. Sometimes wires also have the ability to directly manipulate data. Selecting the wire shown above and checking the Properties window shows me the default wire behavior. The value put on the wire is being passed on through. The dropdown box also gives me the option to set the value to 0, overwriting the input value. If that doesn’t do enough for me, I can also select the “Edit values directly” checkbox and enter an expression of my own, using the input value or any diagram variables available through the state object. This is definitely an interesting feature; however, on the block diagram wires with custom properties look exactly like wires with default properties, potentially leading to confusing block diagrams if this feature is overused. [u][i]VPL looks practically unusable. Are there any redeeming features besides the IDE?[/i][/u] Throughout these write-ups I’ve used the term “node” to refer to any block diagram element whether it is taken from the Basic Activity palette or the Services palette. In truth they are not the same. Basic Activity nodes are similar to sub vis. They take inputs, do some stuff with it, and return an output. Service nodes are more than that. They run continuously in the background. Depending on the service, it may wait patiently for you to ask it to do something, or it may work independently in the background sending you periodic update messages. If you think this sounds remarkably similar to [i]actors[/i] or [i]active objects[/i], you’d be right. If you try to use VPL to do the same type of low level data manipulation we’re used to doing in Labview, I agree it probably isn’t worth the effort. It is clearly missing all sorts of core functionality needed to be effective at that level. However, I don’t think VPL is intended to be that kind of language. VPL is primarily a message routing language. Its purpose is to explicitly define message flows between concurrent services (i.e. actors) to accomplish a larger goal. All those decisions that look questionable to us make a lot more sense when you think about VPL as a message routing language instead of a dataflow language. Don't get me wrong--it is dataflow, but not in the same sense Labview developers are used to. In fact, the relatively few hours I’ve spent with VPL leads me to believe it is far better at defining and showing interactions between actors than anything we have available in Labview. [u][i]Hey Dave, wrap it up already[/i][/u] With the increased visibility of actor oriented programming within the Labview community, the difficulty in concisely and clearly showing message routes and message sequences between independent actors is certain to become more apparent. Simple message routing can be done in Labview using a mediator—a loop that reads a message and places it on the queue of the actor it is intended for. If the message route requires several hops before getting to its destination the complete route information is no longer contained in one place. Good for modularity, not so good if you’re trying to understand a message’s path through the application. Sometimes actors need to exchange a sequence of messages to do a task. Like multi-hop routes, it is hard to show this sequence concisely in Labview code. The overall sequence must be inferred by digging into individual message handlers and tracing through the code. Clearly presenting multi-hop message routes and message sequences is something I’ve struggled with in my own code. There are no good ways to accurately communicate that information to other developers, and to some extent you just wave your hands and hope they are familiar with actor oriented programming. I started looking into VPL a couple weeks ago mainly to get another perspective on dataflow languages. I expect it to address the same types of issues Labview does. Instead I discovered the relationship between VPL and Labview is an odd mix of contradictions. VPL is not a direct competitor to Labview, but its higher level of abstraction does pose a distinct threat to Labview’s simple concurrency model. It’s not intruding on Labview’s domain in the test and measurement industry (yet,) but it does make it harder for Labview to gain acceptance as a general purpose concurrent programming language. In short, VPL doesn’t [i]replace[/i] Labview, but in some ways it [i]surpasses[/i] Labview. I’m quite curious to see how well VPL scales when there are tens or hundreds of messages between actors. How much clarity does it lose? How easy is it to accidentally break an app? How long will it take to implement? My gut feeling is an experienced .Net developer using C# to create services and connecting them using VPL would spend roughly the same time as an experienced LV developer writing the same application in Labview using actors, but when the code is complete the VPL code will provide a much better high level view of what is happening than the Labview code. A better understanding naturally leads to faster changes and fewer bugs. And in the end, isn’t that what we all want?
1 point