mje
-
Posts
1,068 -
Joined
-
Last visited
-
Days Won
48
mje's Achievements
")

-
 It would be news to me if there was a way of doing it. In the past I've wanted to treat blocks of a large file as native file system objects but never found a way of doing it at the operating system level. I figured you're either hanging onto a refnum/handle of the big file and synchronizing I/O operations yourself, work with a folder holding a collection of files to merging after the fact. Neither was ideal but I chose the later since I didn't need real-time read access and it's a whole lot less work.
 -
Yeah, I saw that idea exchange entry. It broadly falls under the same issue, but this is a bit more specific. I'm fine with the blurriness that can result from the OS scaling the native display, that's expected when there's not an integer multiplier mapping between the scales. At 200% my display isn't blurry, it's just more pixelated, but a fractional scale of 150% or the like will produce those effects which I wouldn't classify as a defect. However there's something special about the mouse cursor-- while the rest of the interface is scaled by the OS as expected, the custom LabVIEW cursors are not thus adversely affecting usability. However they can be scaled. Take for example this screenshot of the same bit of code taken via the Windows Step Recorder: Somehow there's an auto-magical cursor scaling in the image that doesn't appear on screen. Shenanigans I tell you. As for DPI, Windows handles that quite elegantly. There's a seamless transition between modern applications and those which the OS is treating as legacy, no fiddling of mouse settings are required. Windows 10 is very impressive for this and is one of the reasons we only plan on supporting high resolutions for our LabVIEW applications under Windows 10.

-
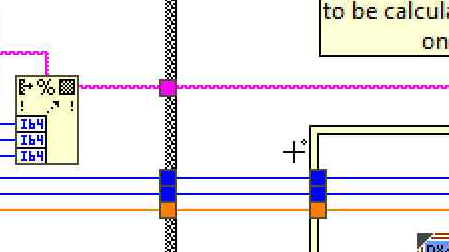
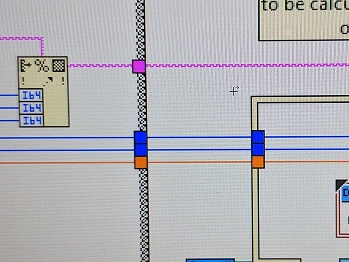
TL;DR: Is there a way to fix the small cursors in LabVIEW on Windows 10 while working with desktops scaled beyond 100%? Now that I routinely work on 4k displays, the legacy IDE and applications created from it are becoming a bit hard to use. The non-system cursors LabVIEW use are too small-- they don't scale like the rest of the user interface on Windows 10, inclusive of the system provided cursors: That cross on the diagram is smaller than one of the tunnels. To add insult to injury, when I capture a screenshot with the cursor it miraculously scales in the image, so I'm thinking this is something LabVIEW is doing with it's cursors that prevent the OS from resizing them (the rest of the IDE scales beautifully with the build in Windows scaling). Also why I'm posting an image of my screen (don't tell anyone). I can work around this by having the OS to flash the cursor position when I lose it. Which happens a lot. But I am worried about complaints that may creep up from users of our applications because the non-system cursors on front panels are similarly unscaled. Is there a way to fix this? I'll preemptively say NG isn't an option, there are reasons I'm still working in LabVIEW 2017.
-
Displaying a transparent PNG programatically
mje replied to Neil Pate's topic in Development Environment (IDE)
Seriously vugie, BitMan is a fantastic library. -
Yep, I've confirmed that mucks things up good. Looks like I'll have to go hooovahh's route and cache the results of entire strings at a given font setting. Ugly, since the initial render will still be slow, but follow up renders will be quick.
-
Given we're talking 7 or 8 bit characters depending on if you care about extended codes, and the first 32 codes aren't printable, I'd go with an array for direct indexing.
-
Come to think about it, this is LabVIEW-- unicode/multi-byte isn't exactly a thing. So there's not a lot of printable characters. The interface uses the same font + size for the whole display, so when it's changed, run Get Text Rect.vi on all possible characters caching the results, incurring a relatively small cost, then the bounds for any string can easily be calculated without making calls to the underlying GDI layer. Should be fast. May need to have the caches keyed by style (bold, italic, none, or both).
-
I've identified a bottleneck in some of my more text-heavy picture based user interfaces as calls to Get Text Rect.vi. It's adding on the order of 100 - 1000 ms rendering time to my interface which otherwise does things in 10 - 100 ms depending on data density. To make matters worse it gets slower by a factor of 5x or so if a user-defined font is used (anything other than application/system/dialog). User-defined fonts are required to alter text size, so...yeah. S. L. O. W. I'm platform locked so the GetCharABCWidths method springs out, but I'd have to dig a bit to figure out the data structures used in that call as I haven't really dealt with it before. Has anyone tackled this before and can perhaps suggest alternatives?
-
Good one, you may be onto something. I'll do some investigating and see what surfaces. Cheers!
-
Now that I'm doing more thinking about this, a VI that crawls the loaded VIs in memory as part of the splash load may do the trick. Dynamically liked VIs and clones would need to be handled differently.
-
Indeed, it's your solution that got me wondering if there's a way to get notification. All the data is clearly available in VI server to do a polling solution, but that would be pretty adverse to performance. A few hundred UIs to poll and it would have to be frequent enough such to catch freshly loaded VIs before they're displayed to avoid twitchy behavior. All in I think I'd be back to square one having to modify each VI to keep the panels hidden until the global API has had a crack at transforming the panel otherwise it could look pretty hack-ish.
-
I'm wondering if there's a way to hook into VI server and register for notification any time a front panel is loaded. Not a specific front panel, but any in the owning application instance. I'm thinking of a VI that can run in the background and inspect each front panel that gets loaded to operate on it. Immediate use cases of interest are to apply automated interface scaling and language translation at run-time. I'm brainstorming ideas trying to find something that scales better than having to modify each and every user interface VI in an existing code base to make calls into a new API that is created.
-
I see, yes that makes sense. I get how that's a problem in LabVIEW since there is no lower level representation presented beyond the block diagram. For example when I debug my optimized gcc code I can always peer at the resulting assembly to get an idea of what's going on when code seemingly jumps from line to line or look at registers when a variable seemingly vanishes and never makes it's way into RAM. Without a lower level presentation, you're pretty much hosed with respect to debugging if any optimizations are enabled. I withdraw my objection, especially since there's some reference to optimizations in the dialog if I recall. Seriously though, thanks for taking the time to set me straight. Cheers, AQ.
-
I'd expect compilation to be different, how else will all the debug symbols get put in place? But what I don't expect is all the other stuff you said goes on. The text presented to me in the dialog says "Allow debugging." Not "Enable debugging, and constant folding, and loop invariant analysis, and target specific optimizations, and a bunch of other stuff." I expect the checkbox to toggle letting me attach a debugger to the VI to perform various forms of debuggery. Stuff like breakpoints, probes, step execution. Taken directly from the LabVIEW 2017 context help: I've been using LabVIEW since the 90s and had no idea other optimizations were tied to this checkbox until you mentioned it the other day. Nowhere had I ever read it was. It may be obvious to you, someone who's intimately familiar with the innards of LabVIEW, but LabVIEW.exe is a black box to me. That's what I mean by hacked up. There's a discontinuity between the function and indication of that checkbox. The fact that the setting affects things other than debugging means one of two things: the setting shouldn't be used for these other purposes; or the function of the checkbox has not been clearly expressed. I'm not trying to argue against having these optimizations and such. They're good and part of what makes LabVIEW so efficient. But since that checkbox really isn't "Allow debugging" and more "Allow pandora optimization", it may warrant some review of how the information is presented to the user? You'll also be my hero if you can get the word "debuggery" into updated UI or documentation.
-
Well, it's not different at all-- the beauty of naivety! That checkbox is voodoo as far as I'm concerned, and given what you've said I'd argue it's either grossly misnamed or misused. Literally. It says one thing and does a "thousand" of other things. You're already at the infinity point. Your point about optimization is completely valid. I don't think user optimizations should be a different class than compiler ones for this context. I'm on board with what you're trying to do: a VI scoped switch to allow code compilation. I'd still argue the debugging flag is the wrong place to go about it, just because that flag has been hacked before doesn't mean it's the right thing to do again. The argument for scaling comes to mind as well. What if I wanted to so similar things for unit testing, reentrancy, or general mischievousness?