
X___
-
Posts
437 -
Joined
-
Days Won
29
Content Type
Profiles
Forums
Downloads
Gallery
Posts posted by X___
-
-
OK the Help file not showing its content is courtesy of MS. Simply "unblock" the chm file using Properties, 'cause:
"The file came from another computer and might be blocked to help protect this computer"
-
On 1/19/2022 at 12:16 PM, hooovahh said:
I messaged the site admin.
Bump.
-
On 6/17/2021 at 10:20 AM, paul_cardinale said:
After a lot of digging, I found the bug (in my code). It wasn't happening just when one Y Control depended on another, but whenever two different types of Y Control were both in memory.
The fix is attached. I've also done a bit of cleanup (including closing a dangling VI ref), and some minor improvements of the help. It's backward compatible; no need to rebuild anything, just run the new installer.
Y Controls - Version 2.0.3.0 Source.zip 1.97 MB · 9 downloads Y Controls Support - Version 2.0.3.0 Installer.zip 1.79 MB · 8 downloads
If I open the content of the "Installer.zip" file, it appears to be missing the "Install Y Control Support.vi", "UNInstall Y Control Support.vi" and "Installer READ ME.txt" that you had in the 1.x version in that thread.
If I copy those items in the Pure G Installer version 2 and run install, things seem to work fine.
For some reason, the help file is showing a TOC but the content appears blank (same for version 1 BTW, so it might be something related to my installation in LV 2021 SP1 64 bit/Windows 10).
-
-
On 7/7/2022 at 12:06 PM, sam said:
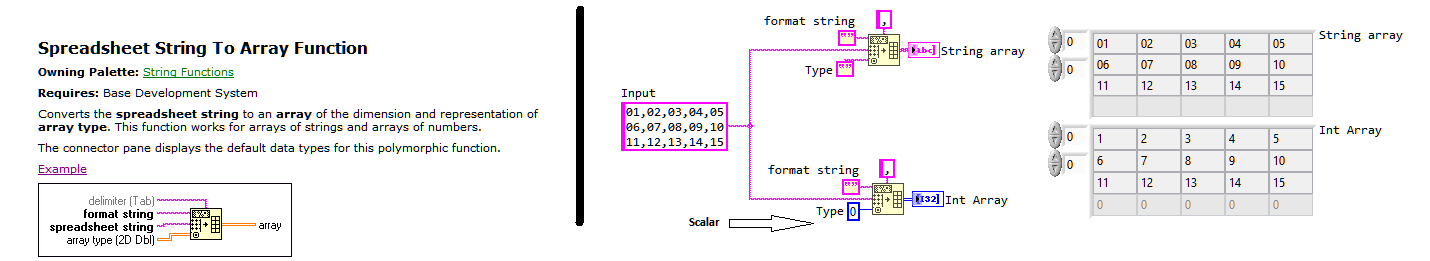
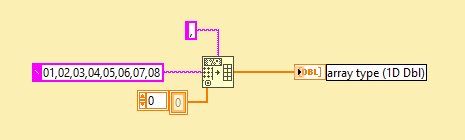
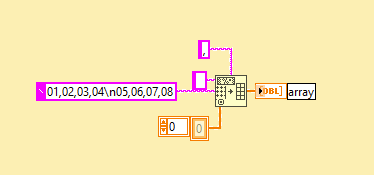
I've been surprised today with one of the LabVIEW's most useful functions (imo) which I use all the time. After so many years and only now seeing this behavior/feature. I thought I share it 🙂
I've always used an empty array of N-Dim for my desired type input. only to accidently find out today that I can also use a scalar for the type. ha!

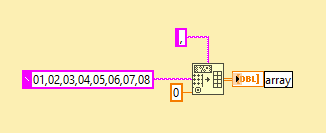
But if you provide a string that should be interpreted as a 1D array, and chose "create indicator", the created indicator is a 2D array:
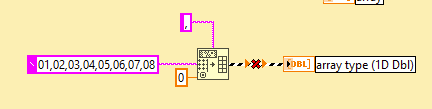
Try to force the output to be 1D by connecting a 1D array indicator, and you get a broken wire:
In other words, it seems that if you want a non 2D output, you need to specify the type.
BTW, in the first diagram above, the 2D array output contains a single row, so the string is properly decoded (ignore the missing format string).
Bonus: did you know that if you set the expected type to be 1D (and obviously the output to be 1D), a "2D" string will be cast to 1D?
-
8 hours ago, Rolf Kalbermatter said:
Fun! Good luck in your new endeavor. But the LabVIEW development team loses a very valuable and important member for sure.
Probably not the first one and most likely not the last?
-
From the link above:
QuoteLabVIEW is now third party software for NI?
Kind of consistent though with making it its own independent product line, the survival of which will be justified by number of annual licensed paid for...
-
The software subscription model is the future...says this article of 2013
I wonder whether NI has any idea of the "churn rate" discussed there. I guess the first year will give them a clue.
I also wonder whether the same brain who made the NI logo become a green deflated ..NI. is at the origin of this marketing decision? And is now gone, after having made wonders.
-
It turns out that this was a classic case of a spawned VI and orphaned references (and after all, swapping my VI for the 3-button dialog did not change the pattern, although it improved the look), even though I am not quite sure this all makes sense to me...
But anyway, the bottom line is that I managed to circumvent the problem by keeping some references alive in a hidden launcher VI which shuts down when no more windows are left open.
-
Let me try this @Wiebe@CARYA
-
I listened with interest to this presentation by Wiebe Walstra: https://labviewwiki.org/wiki/GLA_Summit_2020/A_By-value_OpenCV_Library
Does anyone know what the status of this is?
-
8 minutes ago, ShaunR said:
If you can do that, you'd be a billionaire.
We are working on it. We just need more funding...
-
 1
1
-
-
1 hour ago, Michael Aivaliotis said:
Having a bad day? 😀
Just reflecting on what some not-to-be-named companies have accustomed us with...
But in answer to your question, if you have irreversible actions taking places (that would be the case in the type of stuff I do, which is mostly computational when it is not DAQ - I don't suppose you want to undo drilling or cutting physical parts 🙂, clearly you need to store intermediates states to be able to backtrack to those and since juggling between different cases might be tricky. this might be your best approach...
And since even the not-to-be-named company has been unable to find a satisfactory solution despite their elite team of programmers after 20 years (not mentioning that there is no undo in tons of locations in the IDE), this is clearly not a trivial problem. But that might be one sentence too much. Hold on, Musk hasn't bought that site yet, has it?
-
I'd just pop up a dialog with a "Please contact our company's support channel and Idea Exchange forum to discuss or request implementation of this feature. Reminder: access to future improvements of our software is reserved to continuing subscribers. Other cheaper and more powerful alternatives may be available".
-
2
-
-
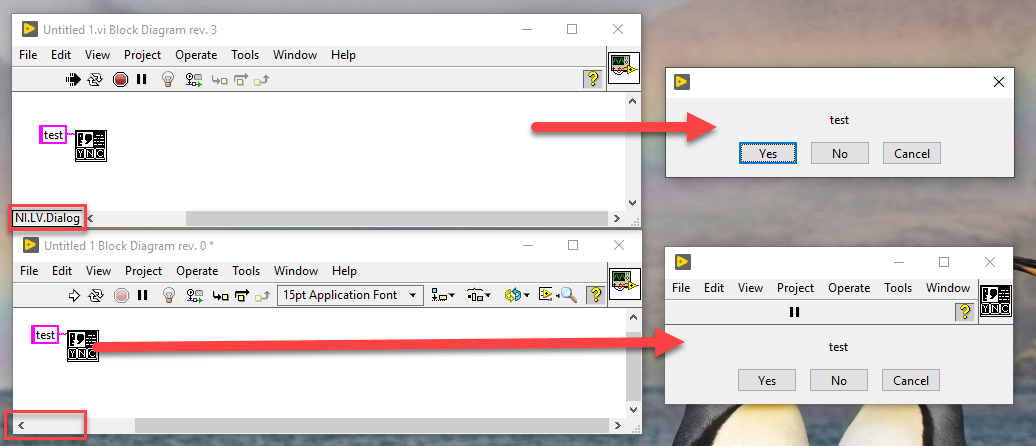
7 hours ago, LogMAN said:
By any chance, is your main VI launched in a different application context (i.e. from the tools menu or custom context)?
Here is an example where the dialog is called from the tools menu (top) while the front panel is open in standard context (bottom).
Nope. The CORE.vi was called by the 3-buttons dialog VI (the "white" version of the CORE.vi, i.e. a wrapper to the CORE.vi), itself called from a dynamically launched VI.
As I said, a pared down test version of the program was working just fine (which is why I was not able to post such an example).
I guess I must be getting old, as I have decided to move on without fully understanding what was going on, having solved this issue with a custom dialog VI.
This being said, if someone can recreate a situation such as illustrated in my original post (a non-reentrant stopped VI whose icon in a calling (stuck) subVI being debugged shows the "green" arrow), maybe we'll get closer to figuring out what was going on (no need to focus on the CORE.vi).
-
1 hour ago, ShaunR said:
'There's your answer. BTW. If you try to debug it, it works fine
Still don't get how this is my answer, in particular to the "running VI arrow" in the calling VI and the stopped CORE.vi question. I think I do remember indeed that putting a breakpoint in the CORE.vi and stepping through it might have prevented it from "aborting" (for lack of a better understanding of what is happening), but then, when that CORE.vi is/was called from within the main VI, things were working fine, so it doesn't really explain anything for me.
But to some extent, this doesn't matter anymore at this point.
-
Follow-up: replacing the 3-button dialog window with my own (working in essentially the same way, if a bit cleaner) solves the issue (for now).
I still would like to understand what happened with this VI...
-
2 hours ago, Lipko said:
I don't fully understand your post. Does the problem also occur if you don't have the front panel of "Three Button Dialog.vi" oneped? Does it occur if only the caller vi is open? I often make dialogs from a "promt user input" express vi by opening it's front panel thus converting it. If I forget to close its front panel, all sorts of similar race condition things occur if I run the main vi. Never cared enough to have this sorted out though...
I am discussing run time behavior. I am not editing the 3-dialog button VI. The snapshot I showed is the end result of the app running (and getting stuck).
The FP of that dialog window opens up via an invoke node in that dialog VI (the first part is formatting, as I mentioned in the previous post - the VI can be checked in vi.lib), and then there is a simple event loop that waits for a button click, which ends the execution and closes the VI. So when that dialog VI is reached in my Notebook VI (at the green arrow location in the original post), the dialog VI executes, formats itself, opens its window, and by some magic, quits the event loop without a click and doesn't close the window.
I have put error indicators in that 3-dialog CORE VI to check whether any error was generated, but couldn't see any, which makes that (putative) behavior so puzzling to me.
-
6 hours ago, ShaunR said:
Those dialogues (one, two and three button) run in the root loop. If there is a race condition, LabVIEW is screwed. Never use them. Spend two minutes to make your own dialogue.
I had to read this to learn something new (about bugs and wasps): http://www.labviewcraftsmen.com/blog/the-root-loop
However that post says that the 3-button dialog (which I am using) does not require to run in the root loop...
I generally write my own dialogs, but this one is convenient (although style-wise, pretty dated) because of all its fancy formatting. I'll try with my own regardless, just for verification purpose.
-
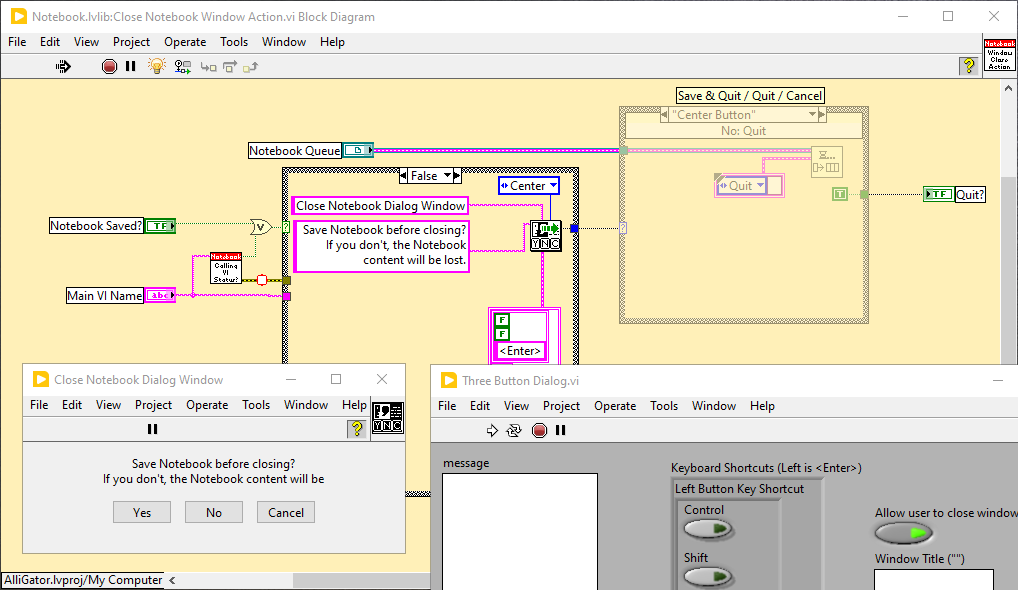
I am staring at this:
which shows a snapshot of 3 VIs, two of them being in vi.lib/Utility/error.lib VIs (visible FP), the other one being a subVI in a library of mine.
The snapshot illustrates the puzzling situation that I am encountering: Three Button Dialog.vi, whose state is idle as is clear from the snapshot (but is also confirmed by the LabVIEW Task Manager), is however "running" as indicated by the green arrow in the calling VI (whose BD is shown in the back).
The "Close Notebook Dialog Window" is nothing but the Three Button Dialog CORE.vi of the error.lib library, and is also idle.
In other words, the calling subVI is never stepping out of this situation and the only way for me to recover is to abort the VI.
Question: how is THIS even possible?
Background information:
First of all, I wished I could boil this down to a simple example that I could share, but I haven't been able to reproduce this yet in a bare bone project.
Now, the weird thing is that this situation occurred after what I thought would be a simple refactoring of my application, namely dynamically launching my consumer loop, which itself launches the Notebook VI whose subVI is now unresponsive.
Before:
Main launches Notebook dynamically.
User closes Main. Only Notebook remains live.
User clicks Notebook's "close box" which call the 3-button dialog.
User clicks "No", Notebook closes.
After:
Main launches Consumer loop VI dynamically.
Consumer opens Notebook dynamically.
User closes Main which sends a "Quit" message to the Consumer loop, shutting it down. Only Notebook remains live.
User clicks Notebook's "close box" which call the 3-button dialog
3-button dialog is idle, Notebook is stuck waiting for it to finish.
Something is going on (or rather is not). What could it be?
LabVIEW 2021 SP1 64-bit Windows 10
Edit: I forgot to mention that none of the VIs above are re-entrant and that the 3-button dialog CORE.vi is supposed to run as a modal window.
-
- Popular Post
- Popular Post
4 minutes ago, ShaunR said:Overflow and Reddit - give me a break, Reddit is a hell-hole of politics and Stack Overflow is full of stuck-up people who would rather chastise you for how you formulated your question.
As if there were no such personalities on NI forums...
-
5
-
4 hours ago, hooovahh said:
Yeah one thing I wanted to do was only show it when the number of signals were greater than the number of rows shown. If I have room for 4 signals but only 3 were selected to be graphed, I figured I could hide the scrollbar. But that isn't true if the user scrolled down previously. A pain for sure. Always showing it at least never leaves the user being stuck. Oh turns out I did actually post my code that attempted to do graph and selection of signals differently here, with a youtube demonstration.
I am certainly not going to rewrite a Plot Legend, as there are so many functionalities I am relying on (however buggy they are), that this would be way too much work.
-
Another interesting tidbit about the Index Display is that if you edit its Description and Tip, the Tip does show up as expected when hovering over the index (and its description in the Help window), but if you have not set a Description for the array itself, that index's description will show up for the whole array (but not the index's tip).
Define both Description and Tip for the array AND its index, and things work as expected.
It's tough to write code that does behave properly in all cases...
-
At this point I am just showing the index display at all times and hiding it with a disabled button whenever I don't need it.
I am not expecting this to be fixed before 2030 and since I am not planning to upgrade to 2022 and later, that will be it.


LabVIEW 2021 missing from profile version selector
in Site Feedback & Support
Posted
The problem with versions posterior to 2021 is that you'll have to find a way to link that information to the actual payment of the subscription to NI.