infinitenothing
Members-
Posts
372 -
Joined
-
Last visited
-
Days Won
16
Content Type
Profiles
Forums
Downloads
Gallery
Everything posted by infinitenothing
-
I'm not sure but does convolution rotate the array so it wraps around? If so, there might be some issues with a nonsinusoid. In my case, when the waveforms are perfectly aligned it would be comparing the first signal's segment that looks like this: / to the second signals segment that looks like this: \ making for a bad match.
-
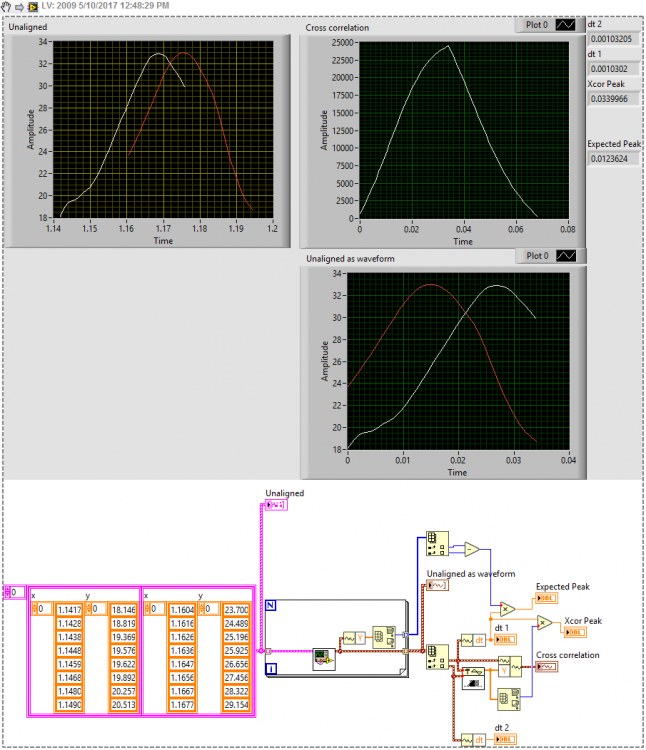
Huh, not sure why the snipping tool isn't working. I got a peek value as shown in the upper right of the graph but that peak doesn't seem to correspond with anything. I backsaved the projected the old fashioned way and attached it as a zip Find lag example with correlation.zip
-
Thanks for the code. I made it into a subVI and used it as I think you wanted but the answer it's giving me is way off the expected 0.006 or the shift of 0.012 if I ignore T0
-
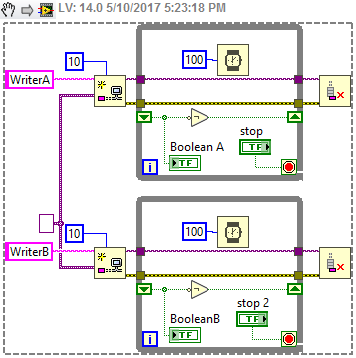
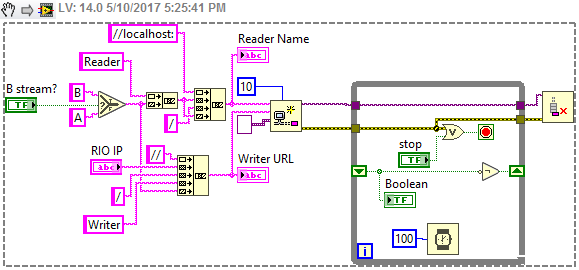
While your writer names are unique in testingendpoints.vi, that's the wrong thing to make unique. They are all using the same default context. Check section two and Smithd's context suggestion. As for rt stream listener.vi, you'll only be able to have one app connect at a time. If you want multiple apps to connect, each needs their own reader name (endpoint1,endpoint2, etc)
-
My problem is that correlation takes in two arrays where I have 4: X orig, Y orig, X shifted, Y shifted. I can't figure out how to get 4 into 2.
-
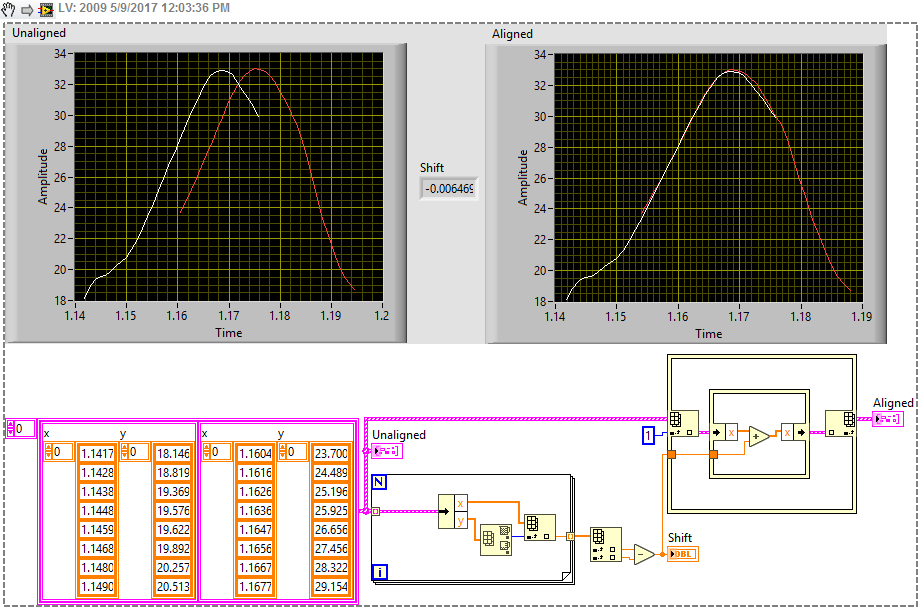
Thanks for the code. I get what you mean now by integration. That's a neat idea. I graphed the input into the integrals and I noticed that XY were switched and the interpolation function was outputting something weird. I also tried deleting the first 3 xy pairs out of the first waveform and the alignment is really off though that might be a function of previous issue. Still, the ideas were useful and I might be able to take it from here.
-
Does it take xy data or just waveforms and intensity plots?
-
I appreciate your requirement gathering. Ideally the algorithm would use as many points as possible so if there was only maybe 10% overlap (see image below), hopefully it would be able to work, and if there was 95% overlap, ideally, it would use 95% of the points for the match. The offset won't be bigger than ±0.02 I think I understand the solution you suggested. You mean interpolation right? I can probably make that work but I was hoping that someone knew of a more standard way of solving my problem. No reason to reinvent the wheel right?
-
Thanks for the input. I'm using 2016 but I used the code capture tool to try and backsave it in 2009 incase someone wanted the dataset. Here's some potential issues I'm concerned with. (last minute requirements ): The size of 10 points for the pattern seems arbitrary. 0.5 tolerance also seems arbitrary The X data isn't really used. For example, your method assumes that the two data sets will be evenly spaced and equally spaced. Fortunately they are pretty close in my example but I'd rather the algorithm could elegantly handle the data if the second data set had 25% more space between the points. You seem to only be moving the index in increments of 1. That means that I could have an error of up to 0.5 dx.
-
I have xy data for two waveforms (on the left). I'd like to figure out what's the offset between them ignoring any points that aren't in the waveform. Right now I'm just grabbing the peak but if the signal get noisy that might not be a great idea. Is there a way to take into account the whole functions?
-
View Executable on Web browser
infinitenothing replied to Cat's topic in Remote Control, Monitoring and the Internet
If you're looking for NI's web service examples to walk you through some of your links look here: C:\Program Files (x86)\National Instruments\LabVIEW 20xx\examples\Connectivity\Web Services You won't need the RTE on the client computers but you'll also have very limited interaction. Think text and pictures and not panels. If you need a remote panel look into the above post. You should also look into your client requirements. Some other options open up if you are willing to run silverlight or flash. Those options are becoming obsolete over the next decade or so. -
reading LCD characters(16X2)
infinitenothing replied to Nishar Federer's topic in Machine Vision and Imaging
Sounds pretty easy. Get a smart cam and a ring light. I should moonlight as an NI sales rep. -
USB2.0 High Speed Serial Communications
infinitenothing replied to Gary Armstrong's topic in LabVIEW General
It sounds like "can't attain" means that your application doesn't get a response. That could easily be caused by an application error. Which is likely, seeing as how you misuse locals. Also, I noticed your Packet TR isn't opening the port or setting a baud rate. I think you need to get rid of the response ID checking and improve error handling. Ideally it would be as simple as "Open Port, create packet, wire that straight into the visa write, wait a second, get all the bytes off the port. View the bytes as hex and see if you can figure out what it's sending back." If you get a good packet back, then you know it's probably just an application error. If you get nothing back, you might want to take apart the uC and see if you can find out what pins to probe or what's going on at the serial end somehow, I guess I'd want to know what was working before. There is some chance it's a driver issue and you have to live with it. if you get back a visa error, then we can look at solving them. -
USB2.0 High Speed Serial Communications
infinitenothing replied to Gary Armstrong's topic in LabVIEW General
I feel like USB is a bit of a red herring. It sounds like your microcontroller has a USB to serial converter on it. With real USB communication, you don't have to specify a baud rate. Here's some more info on USB raw http://digital.ni.com/public.nsf/allkb/E3A2C4FE42D7ED0D86256DB7005C65C9 When you say it can't attain 921kbaud, what do you mean? Are you getting an error code from VISA? Is it possible that the microcontroller doesn't support those baud rates? -
tarcking Object tracking - virtual draw, paint
infinitenothing replied to Nerich34's topic in Machine Vision and Imaging
I'm not sure you can do what you want to do with the XY express VI. You need to make an array of XY bundles as shown below. -
tarcking Object tracking - virtual draw, paint
infinitenothing replied to Nerich34's topic in Machine Vision and Imaging
Double click the "Build XY Graph" express VI. Uncheck clear data on each call. Also, you don't have to subtract 1080 or 720 from each x,y pair. You can just click on the top most number on an axis (eg 720) and enter in 0. That will make it so that small y values are plotted at the top. -
support for Google's Material Design
infinitenothing replied to Antoine Chalons's topic in User Interface
Is there anything preventing you from moving the graphical objects around? There's some property nodes for that. As for the z-order, you can vote for that here: https://forums.ni.com/t5/LabVIEW-Idea-Exchange/Programmatic-Manipulation-of-Object-Layer-z-order/idi-p/1262886 -
support for Google's Material Design
infinitenothing replied to Antoine Chalons's topic in User Interface
I thought it was a bit vague in terms of what you want. You want another UI theme in addition to classic, modern, and silver, or something that's more evolutionary like NextGen? -
To the rest of us out of the loop it's just spam though
-
How did your program exit? Did the enqueue timeout? If not, the rate is probably limited by the camera. If so, your rate is limited by your disk. Are you using a laptop? You can get an SSD for <$300. How big did you increase the queue size. If you use 64 bit labview and have tons of memory, you should be able to store all those images to memory. Actually, how are you benchmarking your frame rate? I would benchmark it in the top loop and output the delta t to a chart so you can see if it goes fast while you are using memory.
-
Lookup or add Variant attribute using IPE example
infinitenothing replied to Michael Aivaliotis's topic in LabVIEW General
There's no advantage in the lookup case. That was just to show syntax. The advantage in the increment case is the same as with the other IPE border nodes. It provides a cleaner syntax and, if the child variant is large, it might improve performance by avoiding a copy.


