

GregSands
-
Posts
264 -
Joined
-
Last visited
-
Days Won
26
Content Type
Profiles
Forums
Downloads
Gallery
Posts posted by GregSands
-
-
I've been thinking the correct way to do this is to allow SubVIs to be created without a Front Panel; instead, integrating the interface UI into the BD itself.
I suggested pretty much this idea a couple of years ago, but it's suffering from a lack of kudos and discussion. The core of the idea is that the BD is the only required part of a VI, but it's possible to add one or more FP views which could give different views for UI, debugging, etc, but only when required. 99% of my subVIs have no requirement for a FP, and I often don't even worry about arranging things particularly nicely, as once created, I never look at it. For example, every Class Accessor VI - why have a FP at all?
Darin's pic is not a bad addition either, though it probably only makes sense for small subVIs - and most are, at least in my experience.
-
 1
1
-
-
I have a slightly different approach when matching 4x VIs to 5x VIs (or more often 3x for the many Vision anomalies) - my preference is to keep the VI icons fully aligned, and hide bends on both the top and bottom wires behind the non-4x VI. That seems to me to minimize the internal stress of the block diagram (i.e. makes me happiest).
I almost never run into Rolf's problem within knowing whether a wire is attached because I work hard not to have any wires going behind unconnected VIs - if it's touching, then it's attached. Oh, and I don't mind triple-clicking.
-
This Hilbert code doesn't cope well with changing the amplitudes (try 3, 7, 10), nor with a different first and last amplitude.
-
-
If subpanels could be added programatically at runtime this would be fine but you can't so I don't know another way to do this.
Your code already has this problem with tabs - what if someone wants more than 20 pages? But since Tab Controls are Enums, I don't think there'll ever be the facility to add pages at run-time.
-
Have you looked at using the built-in Interpolate 2D routine from the Mathematics/Interpolation palette? Dive into that and rework the core to hard-code as much as possible (if your parameters are all constant). What is the resulting image size?
-
I didn't think they did, but I was pleasantly surprised when I looked this morning. Here is the same property for the Tree (saved in 2012), also only available in 2012 SP1 and later.
Tree:FocusItem doesn't seem to work for me in 2012 SP1 (12.0.1f3) - I get an Invalid Property error: The property is not valid for this class.
Listbox appears fine.
-
And I thought you meant LabVIEW auto-correct - you know, the one when you try to put down a stacked sequence, and it places a State Machine instead...
-
In the writer there is a disable structure. If you disable the currently enabled (and enable the other) it will use the previous index reading method. Does this affect the result you see?
No, the results are essentially the same.
-
With Version 3 my dual-core machine gives the following result when the Buffer size is smaller than the number of iterations:
There is still a long wait at an interval determined by the buffer size, but it doesn't usually occur from the start of the run. Both the iteration time and its variability seem to reduce once the long waits start.
-
I was going to suggest using a User Event, which which I'd always thought of as a One-to-Many framework. Just tried it, and this "works" with a time of 500ms, and with proper parallel execution, but Profiling shows that the data is copied on one of the event structure readers. It looks as though multiple registrations sets up separate event "queues", and Generate User Event then sends the data independently to each one. I had never realised it behaved like this, though thinking about it now, I guess it's not surprising.
-
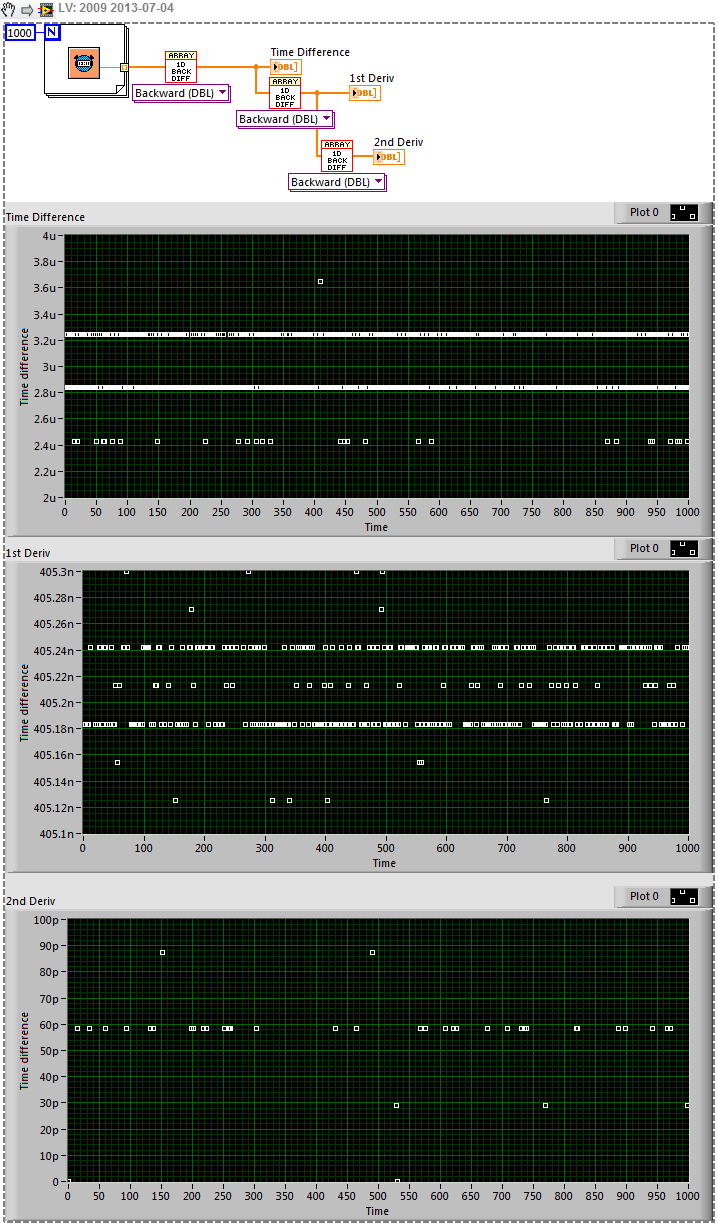
Does anyone want to put forward a theory why we get discrete lines exactly 0.493 usecs apart? (maybe a different number on your machine, but the separation is always constant)
I was going to suggest that's the resolution of the Timer. But when I just put your Tick Count+ VI in a loop, and compute differences, I get:

which says that the resolution is 29.1038pS, but the loop time (with no other work done) is around 405.2nS. So the even spacing is just a function of a largely constant, and almost empty, loop.
-
1
-
-
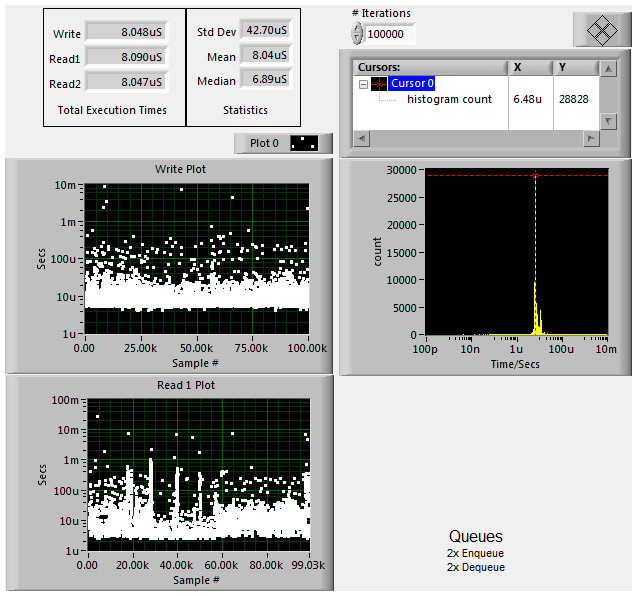
Version 2 has the same problems for me. Firstly, here's the Queues as a baseline:
Next is Buffers (10k iterations with a 10k buffer):
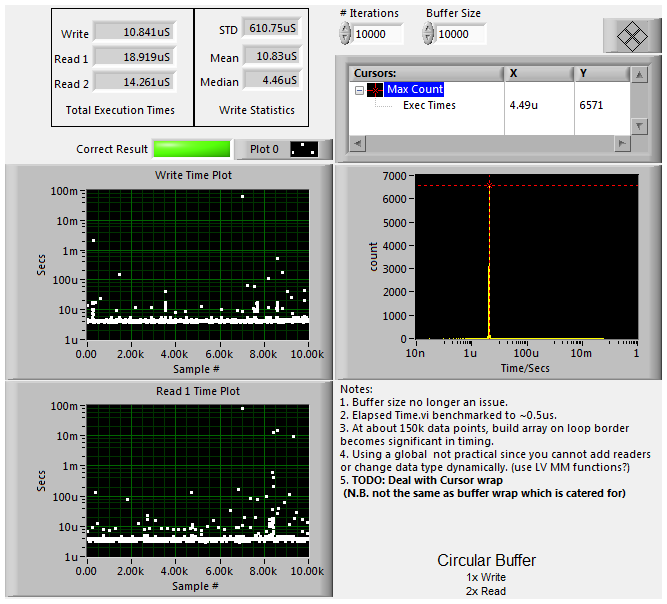
There are no periodic delays, but still some occasional longer iterations (up to 100ms) presumably due to Windows being Windows.
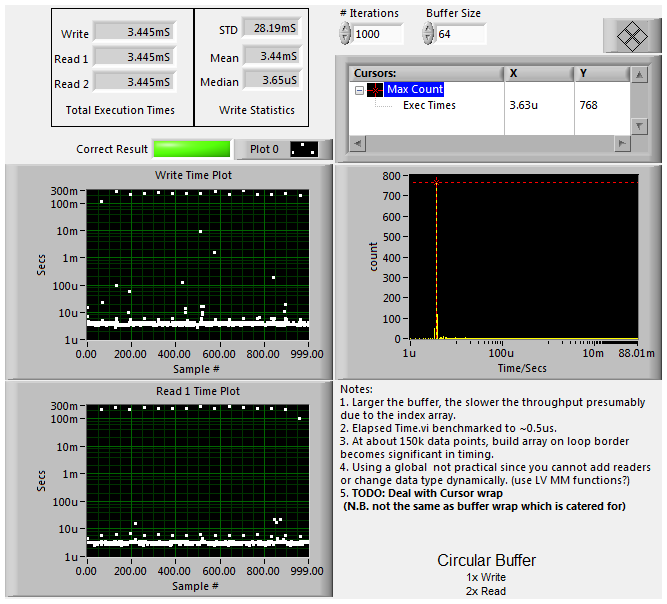
Last is Buffers (10k iterations with a 1k buffer):

The results are the same for both 32-bit and 64-bit LabVIEW, all on Windows 7 x64. I've also run on another machine with 4 cores - this works without any long iterations.
-
Interesting. You can see a lot of data points at about 300ms dragging the average up whereas most are clearly sub 10us.
If you set the buffer size to 101 and do 100 data points, does it improve? (don't run the profiler at the same time, it will skew the results)
The slow iterations seem to occur at multiples of the Buffer Size - i.e. above, at 64, 128, 192, 256, ... If the buffer is bigger than the number of data points, it doesn't occur.
-
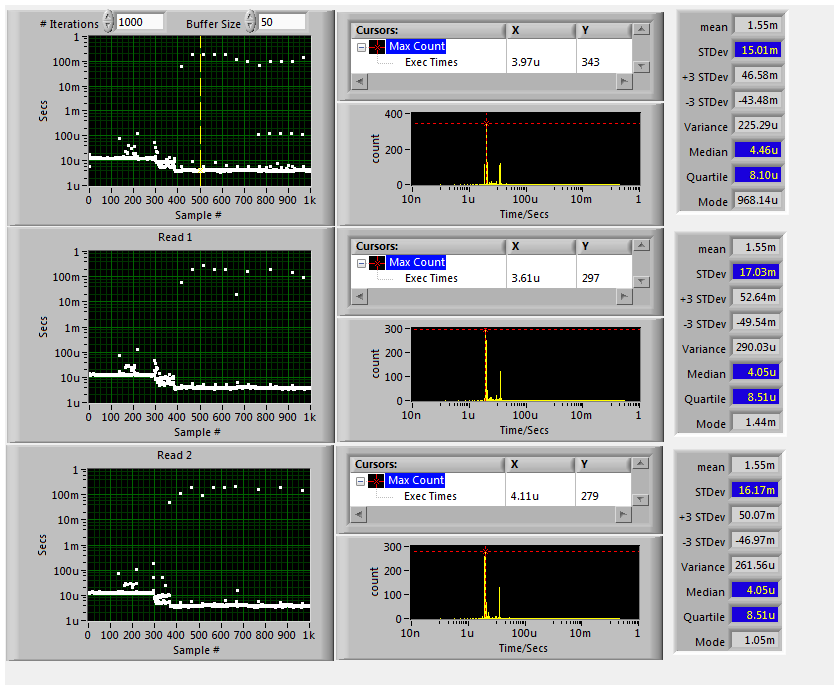
Easy to try. Unfortunately, I get this for the Circular Buffer (LV 2012 x32 on Win 7 x64):
Note the logarithmic scale! I wonder if it is something to do with my machine having only two cores? Here's the Profile Data for the two subroutines:
Profile Data: all times in milliseconds, memory usage in kilobytes.
Begin: Tue, 2 Jul 2013 11:29:38 a.m..
End: Tue, 2 Jul 2013 11:29:46 a.m..
VI Time Sub VIs Time Total Time # Runs Average Shortest Longest Diagram Display Draw Tracking Locals Avg Bytes Min Bytes Max Bytes Avg Blocks Min Blocks Max Blocks Project Library Application Instance
CB Read.vi 3993.6 0.0 3993.6 2000 2.0 0.0 249.6 3993.6 0.0 0.0 0.0 0.0 0.00k 0.00k 0.00k 0 0 0 My Computer
CB Write.vi 1482.0 0.0 1482.0 1000 1.5 0.0 109.2 1482.0 0.0 0.0 0.0 0.0 0.00k 0.00k 0.00k 0 0 0 My Computer
The Queue version works fine, with a mean time of 8.37us.
-
There appear to be a couple of reasons they don't match.
1. LabVIEW returns L in the range 0-255, whereas it is more common to use 0-100 as EasyRGB does.
2. It looks as though that website does a Gamma correction when converting RGB to XYZ (see the formulas - notice it raises to the power of 2.4) whereas LabVIEW does it without correction. That will make a huge difference, and it's non-linear as well.
You can always code up the formulas from the EasyRGB website if you want to use the same! But without a good understanding of color spaces and the acquisition of your particular images, I'm not sure you're really any better off.
The formulae LabVIEW uses are hidden at the bottom of the Color Pattern Matching help page - took ages to find them!
-
1
-
-
There are a whole lot of Vision examples provided in LabVIEW - look under Help/Find Examples.
-
The image above is a snippet, but here's the code if you can't work out how to use that. The VI that does the work is IMAQ RGB To Color 2.vi
-
But with this idea In Beta, perhaps there will be a built-in solution (I don't have the 2013 beta so I can only speculate on what might be coming).
-
As a matter of fact there is an API to access the Lithium data
So does the Stig Nerd want to share? I did try hunting for one but my Google glasses were malfunctioning...
-
1
-
-
Did you collect the data manually or do you have code to scrape it off the web?
Dodgy code that runs very slowly and will break if NI changes their layout! Now if they had an API to some of their online data...
-
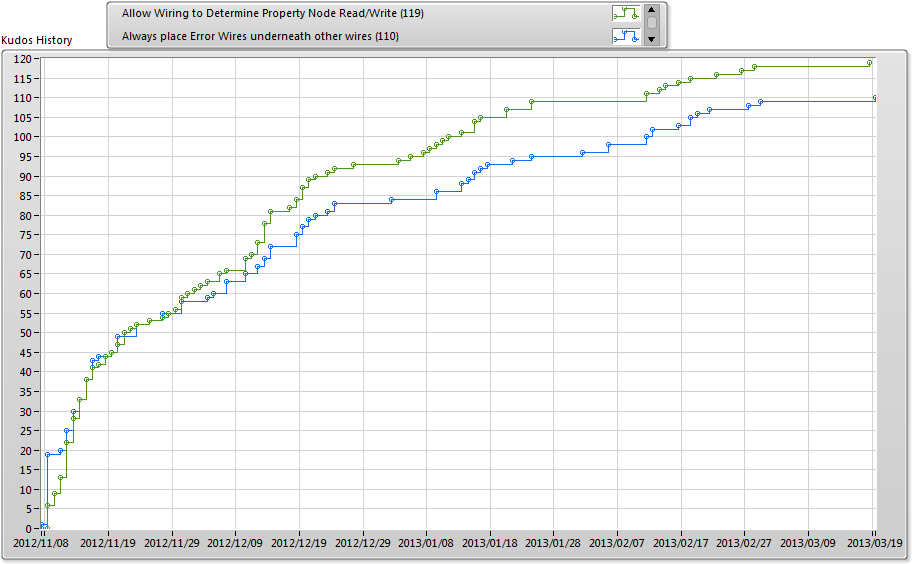
Just out of interest, I've kept tracking these two ideas.
My suggestion was that Error Wires should be placed under other wires, and Darin suggested that the Read/Write status of property nodes should be determined by how you wire them. Both ideas were fairly straight-forward, both are coding-related, both had a simple image and clear explanation, and as of now, both have attracted about the same number of comments (12 vs 16) and kudos (65 vs 70).The current score is 119 - 110, an entertaining basketball game, albeit with poor defence! What's interesting is that (a) there was only a small kick to the ideas after posting here in mid-December, and (b) they still appear to be fairly synchronized in their popularity.
-
1
-
-
LabVIEW's 128 bit timestamp is accurate to 0.05421010862427522170... attoseconds
Accurate. You keep using that word. I do think it means what you think it means.

Precise, sure, but accurate, no. Not yet anyway.
Of interest, why do the fractional seconds truncate rather than round? If using the format in your signature (%3u) I get
2013-03-18T20:40:36.8988289833068847Z current time
2013-03-18T20:40:36.898Z formatted time
-
1
-
-
Once again, just as I think of a possible solution (capturing "dog" separately and concatenating) Darin jumps in first with the answer.


Anyone else OCD about alignment and positioning in block diagrams?
in LabVIEW General
Posted · Edited by GregSands
At the moment you can't link terminals to the con-pane from the BD, so not quite. But my idea was more about an alternative paradigm which views the BD as the essential core of a VI. That is opposite to the NI concept of a Virtual Instrument (i.e. LabVIEW is a software analog of a hardware interface) where the FP defines the functionality. And while such a fundamental change may never happen, the Idea Exchange and LAVA are both places to explore aspects of LV which may not best fit how it is used in practice. Even better when an NI guru chimes in to show where ideas fit within NI's thinking that we all can't see.
So I suggested being able to choose how many FPs you want, from zero upwards. For example, you could have a debug FP - which could look similar to the Probe Window but be savable with the VI, even several different ones. You could have a FP which shows only the I/O controls. You could choose which of several FPs to show depending on the user, logging status, or whether to show an array as an array or a graph. Or you could have no FP at all, and in many cases, that's exactly what you do want.