mross
-
Posts
532 -
Joined
-
Last visited
Content Type
Profiles
Forums
Downloads
Gallery
Everything posted by mross
-
Can anyone tell me if there are some VIs for linear algebra and matrix math using extended precision? Thanks, Mike
-
Shaun and JG, I have been doing this for long enough you would think this little tidbit would have been noticed by me, but I have a habit of not auto-indexing when there are complications. This time I did it and noticed. Thanks for the help, Mike
-
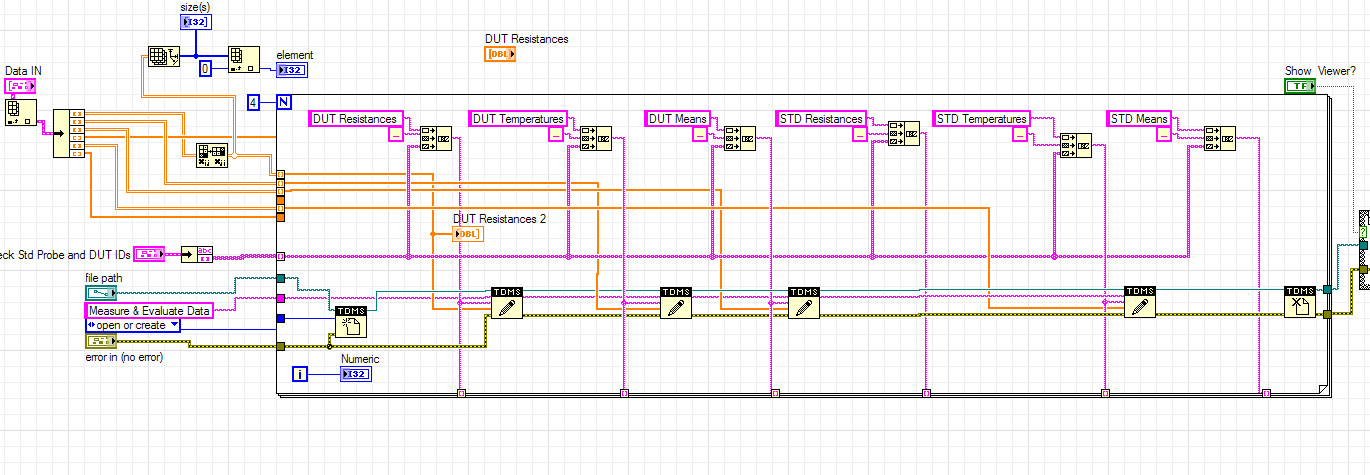
Howdy all, I am learning to work with TDMS. Maybe that is the source of the problem... I have a for Loop that runs one pass and stops even though i have wire a 4 to the count terminal. I do TDMS open, run some arrays to the border for indexing. In the loop I want to TDMS Write some numbers, several times, then loop and pick up the next index, write, and so on. Outside the loop is TDMS Close and I call the File Viewer. I get no errors. I cannot get the loop to continue past the first iteration when it lets the output data go to the TDMS close and everything stops. I may be messing up the TDMS write somehow - the way it works is a bit perplexing so I keep thinking I have it and then it doesn't like what I did. But like I said no errors. I'd listen to advise. The wires are not pretty in the image as I have been tweaking, the open and close used to be outside the loop. Moving them inside changed nothing. Thanks, mike

-
I never see the printer ports (Have a USB one, not parallel). I have given up on the Prolific chips sets for serial com converters - maybe that is what you are using?. FTDI seems to be less troublesome. EasySync is their outlet
-
Shaun, The fellow I work with is taking a controls class from the same prof I did 20 years ago (so I know he is worth listening to). He was reported to have made a provocative statement to the effect: People are always trying to come up with some special algorithm for control, but after screwing around, and around, and around, they always find out the PID would do it better. (my words again) He believe meant that to cover even the asymmetrical case (that should be defined in more detail probably). I suspect he is very good at ferreting out the P, the I , and the D. But that is a weighty statement. I will probably keep it in mind and not give up too soon. Mike
-
Ned, That first sentence is interesting to me. "PID is designed to drive an analog signal, not a digital one." I will soon be wiring to control fluid temperature by varying two streams, one hot, the other cold. I definitely thought I would use PID, but you have me wondering - my control means is to send RPM commands via Modbus to VFDs in charge of pump motors. The plan is to use cRIO, FWIW. simplePID.vi was recommended to me as a starting point, I haven't gotten that far yet. This is digital output not analog. Do you have any advise? My goal is to be able to change from one steady state temperature to another as fast as possible - including an initial overshoot to cool or heat the plumbing quickly. mike
-
This has become an exercise in social engineering and language, very interesting. Mark posted the questions below in the thread quoted above, have these been addressed? What is the final data going to be used for? No discussion of the purpose of the result What does the data represent? No discussion of the real implications of the input data. Why do you want to average / smooth the data? No discussion. What does the peak and valley data tell you about the waveform? No discussion. How do you know if the program is doing the right thing? No discussion. Those questions are reasonable in the absence of a clear description of program goals. I imagine they are hard to answer if either the language gulf is too great, or the questioner has no clear idea of the desired results. When trying to solve a problem for a client who has no idea how to solve it, it is possible to provide good solutions, IF a basic understanding of the higher level needs are understood by both parties. That is why the questions above are so important. AND, if either party is unable to answer those questions, then a successful solution is unlikely. Seems hopeless so far. There is one final item - that of premium membership. It still has not happened. I have to say that I hate PayPal. I simply will not put my personal information in their hands. I would have resubscribed as a Premium member just now, but I need another method to make the contribution.
-
Hello Flower, I am also building a sun tracker so I am interested in your project and progress. Perhaps we can stay in touch about this going forward. Unfortunately, I did not find the attachment you mentioned. It has been a while since I used LAVA - in the past it was necessary to upload vi's to the LAVA storage area where interested people could have access to it. I originally planned to have my tracker stop at sunset (sunset can be in a lookup table or calculated) and cycle to a park position (collector in a horizontal plane to reduce wind loads overnight when it is not necessary to track the sun) until it is time begin the next day. I may decide to park sooner than sunset - also to save power. I will be monitoring Precision Spectral Pyranometer (PSP) and Normal Incidence Pyrheliometer (NIP); when the solar irradiance drops below a minimum value my testing is finished for the day and it is time to rest. I am not using steppers for my project. I report position of the collector platform by using absolute encoders. One is for the solar hour angle from due south, the other the solar zenith angle from directly overhead my location. The motion of my collector comes from linear actuators (worm gear screw jacks). I will just jog the linear actuators into position according to what the encoders report and what the equations say is necessary for the time of day, date and geographic location. In either case (by your method or mine) we must have a decision in our program that depends on a time of day or some other datum which signals time to go to a new day position or a park position. If you can give me access to your vi, perhaps I can help. Michael Ross
-

How to use dynamic event structure?
mross replied to jackmax's topic in Application Design & Architecture
QUOTE (jackmax @ May 19 2009, 09:43 AM) Sorry, I can't use LV8.6. -
How to use dynamic event structure?
mross replied to jackmax's topic in Application Design & Architecture
QUOTE (jackmax @ May 18 2009, 10:56 AM) You should show us the VI. There are too many reasons for the buttons to lock so that information is not useful. -
Does Labview can create variable like C language?
mross replied to lovemachinez's topic in LabVIEW General
Yair, Thanks for that bright and concise philosophical discussion. Not being a student of computer science I couldn't have begun to describe the distinction. I know controls, wires and indicators are not variables in the C, Basic, Fortran sense, but I couldn't have begun to say how they differ. I was taking the similarity more from the English/mathematical word (as apposed to Computer Science) "variable" - a thing that is quantitatively changeable - magnitude, direction. A wire IS variable since it can represent alterable quantity, or in the case of wire representing a string, changeable meaning. Likewise a control or an indicator fit this looser definition. The OED has nearly two full pages devoted to the definition of "Variable." Mike -
Does Labview can create variable like C language?
mross replied to lovemachinez's topic in LabVIEW General
QUOTE (lovemachinez @ May 14 2009, 10:54 AM) Yes and No. A LabVIEW variable can do similar things compared to a C variable, but it is more interesting and useful becasue it has a visual aspect Tim S answer was just fine, but I will add a more. Nobody ever writes all this down because most people learn it quickly by being shown by an experienced user. When learned this way the simplest things seem obvious. But, if you have progammed a text based language and come to LabVIEW alone and with no guidance, then even these small things are difficult and NOT obvious. I hope the following information is helpful. To make a "variable" right click over the Front Panel (FP) a pallette of menus will appear. In the pallette select the Modern or Classic menu. Then select the first menu item "Numeric." The simplest "Numeric Control" looks like a number in a box with a small up/down button to the left. Pick that with the left mouse button and place the icon on the FP. The front Panel is the Graphical User Interface that the program operator sees and interacts with when the program. (Program = "Virtual Instrument" or VI in the LabVIEW development system) This is a control "variable" that can be edited while the LabVIEW VI is running, or while you are in programming mode. If you go to the Block Diagram (BD) (double-click on the control with the left mouse button OR press Ctrl-E on the keyboard to bring the BD into focus) you will see the Block Diagram representation of the control. All the other selections in the Numeric menu, dials, sliders, and so on, are merely different visual forms of a numeric control - they alll have value, format, and representation (double, interger, etc.) just like the Numeric Control. If you right-click on the BD representation of the Numeric Control a menu appears. Pick "Create," then "Indicator." A new Icon appears and a wire connects the original control with the new "Indicator." If you look on the FP you willl see there is a representation of the Indicator. The variable you have created is a Double Precision variable. In a sense the control, the wire, and the indicator are all the variable. The control is the varialbe in a form that is runtime editable, the wire is the means by which the value of the variable is present through out the program, and the indicator is a visual indication of the value of the variable. If you wish to have an integer variable (int), right click on the control (at the FP or BD) and pick "Representation." You can "declare" whether the variable is an 8, 16, 32 or 64 bit integer, or one of the various unsigned integers, or one of the various precision or complex variables by picking from the Representation menu. If you wish to have a string (like char) variable create a control but select the String & Path menu. You can make Boolean (binary variables) with the items in the Boolean menu. Changing the representation of the control will cause a mismatch with the indicator, the value will be coerced (forced) to the form of the data sink (indicator in this case) and the coersion will be represented by a very small triangle where the wire is attached to the indicator. If you change the Representation of the Indicator to match the Control the "coersion dot" will go away. Good luck, Mike -
Instantiate WaveGraph with Open VI Reference (Newbie)
mross replied to Michael Malak's topic in User Interface
QUOTE (Michael Malak @ May 13 2009, 07:29 PM) You should look at the capabilities of VI Server. You can start up many new VIs that way. However, you cannot cause new graphs on the front panel of a VI which is how I interpreted your query. You can only hide and show them by various means, or put them on Tabs and change the visible tab - programmatically. Here is a little demo of how to use the Open VI Reference you mentioned. This example was written for a someone else, but it is useful as an general example. It shows how to call and open a VI and its Front Panel independent of the calling VI. It also shows the use of the Producer Consumer architecture which demonstrates parallel loops, queues, and the user event structure. You will need to put all 4 of these files in your C: directory, or you will have to change the paths to the VIs and data file. (the Data Logging VI also has a path to change). Run the top level VI called ProdCons_experiment.vi. Press the INITIATE DATALOGGING button to invoke the data generation and logging VI. Press the PRESENT GRAPH OF DATA FILE button to to invoke the display a graph of the data file VI. This method allows the Top level VI to continue operation independent of the invoked VIs. It is possible to have sub-VIs to show their front panel when called from within the top level VI, but the top level VI then waits for the sub-VI to finish before proceeding. The original purpose of this was to have a datalogger VI write to a file periodically, and to show the contents of that data file on demand. I use this example to remind myself how this is done. Mike -
Instantiate WaveGraph with Open VI Reference (Newbie)
mross replied to Michael Malak's topic in User Interface
QUOTE (Michael Malak @ May 13 2009, 04:14 PM) You can't "dynamically instantiate" anything without scripting, and that is not where you want to go. We are trying to offer you solutions not pipe dreams. Did you try a tab control? You can put graphs on different tabs and programmatically cause different tab pages to be visible. Or with much more trouble you can move the locations of the various graphs so they are visible on screen, or they are off screen. If you try to manage that with 64 individual graphs you are in for a long, boring, job that will be of limited use to the user. I gave you a way to show absolutely any combination of the 64 plots overlaid in the same graph. Use that and you work is almost done. You could decide that realistically only 4 or 6 graphs provide useful visual information on screen at the same time, and give the user the ability to show any of the plots in any of those graphs. Mike -
Instantiate WaveGraph with Open VI Reference (Newbie)
mross replied to Michael Malak's topic in User Interface
QUOTE (Michael Malak @ May 11 2009, 07:21 PM) Michael, You didn't ask for this, but I will give it anyway. I think it contains the ingredients of a better solution than 64 little graphs. There are other ways to do this, but this one is basic and shows how arrays are manipulated. The attached VI shows a way for you to overlay any of the 64 channels in one large graph. I made fake data in 24 rows of 40 data each. The rows are like your channels. All you need to do is wire your data array into the same input tunnel as my fake data. The UI lets you enter the channels and turn them on and off "on the fly." You could show all the channels at once, but that is clearly not useful. I show the data itself on the front panel so you can get some confidence that the senseless random data I generated is actually doing what I say it is. Array 2 is the same as the graphed data. On the block diagram the operation is quite simple. Starting from the inside out, the array is parsed using the delete from array function. An index of the desired channel is used to pull out the channel of interest (it is the I16 (16 bit integer) wired to the Index (row) input of the Delete from Array VI). The User Event Structure is triggered every time you enter a new channel or turn a channel on or off (for either it is a Value Change). You press the little LED to turn the channel on off, you enter a channel number from 0 to n in the numeric controls next to the LED (Boolean). When the event is triggered the for loop works its way through the channel array and the LED array element by element. Using the default values - Plot 0 is ON and the channel is #9 (the last one shown), Plot 1 is OFF, Plot 2 is ON and gets channel 1 (the channels start from channel 0). Notice the little square brackets inside the input tunnels of the channels and On/Off Boolean array's wires to the For Loop Structure. This is called auto-indexing. The loop automatically works its way through the array when this is set. (Input terminals with no brackets pass their arrays all at once.) On the first loop iteration channel 9 is indexed from the main array (auto indexing disabled for this one), placed into the build array function and passed to a shift register ( the little box with orange up/down arrow) of the For Loop. On the second iteration the Boolean is false (OFF) so the Case Structure runs the False Case which passes the shift register unchanged to the right side of the For Loop. On the third iteration the Boolean is True so the True case extracts channel 1 from the main array and "builds" it into the array with the results from the first iteration. And so on. The For loop stops because the arrays have been run to completion as set by the array size wired to the Count terminal of the For Loop. When the loop finishes all it work the Shift Register, built from the parsed channels, passes its data to the graph and the results are displayed. Shift Registers are way cool because you can build them with any contents you need - doubles, integers, strings, time stamps, Booleans, clusters of arrays of strings, you name it. Each time you change a channel entry or an ON/OFF LED the whole array is parsed and a new graph written (not terribly efficient if you have a huge array, but OK for medium sized arrays. If you pick the Stop Button the Stop event is run and a True is passed out to the conditional of the outer While Loop Structure. the While Loop stops, the loop conditional True Boolean is inverted and used to reset the Stop switch with a Value Property Node. Nothing more is wired so the VI stops. This is a good example worth studying. You will do this sort of thing over and over if you keep using LabVIEW. If you haven't learned it yet the little Light Bulb Icon turns on highlighting and lets you watch the progress of the VI. LabVIEW is a data flow language not sequential. Nodes only begin when all their inputs are filled, and stop only when all their outputs are filled. If you have never encountered this before you will have to think on it a bit to see all the implications. Good luck and enjoy, Mike -
Instantiate WaveGraph with Open VI Reference (Newbie)
mross replied to Michael Malak's topic in User Interface
QUOTE (Michael Malak @ May 11 2009, 05:08 PM) Michael, It sounds as if you want to display 64 graphs simultaneously. From a usability POV that is not a great idea. You could instead choose what you think is a reasonable number of graphs to show at one time, like four for instance. Then you can change which of the data channels you want to show in each one. It would also be possible to have multiple channels overlaying in the same graph, four graphs of eight channels (this is surpassing what I would call usable also). One graph with eight channels overlaid would be useful and very doable. Also you talk about reading a "file with 1 to 64 channels of data. I interpret that to be a 64 x n array. You can do whatever you like with a static array of pre-existing data. Choose what data channel appears in what graph at any time. Choose how many graphs to put up and where - but you need to plan it out in detail. You do not want to be reconfiguring the front panel on the fly for a newbie VI. You can get lot's of good use from the Tab Control. You can put different numbers and size of graphs on as many tabs as you care to set up, and the user can choose the front panel look that suits their mood that way. Regarding "runtime, dynamic, instantiation." Imagine a front panel with four graphs (that way they are large enough for the user to resolve what they are seeing easily). Each graph has a control that turns on and off up to 8 channels (overlaying each other) and a corresponding channel selector. Each time you change a value the graph automatically updates withe the desired data channels. I suggest you learn to use the user event structure. Have it respond to Value Changes of the controls to turn on and off the traces and the channel selectors. It is not much more difficult that that in theory. You can also get lot's of extra functionality in the graphs with the use of the cursors. They will allow you to view up close sections of the data in the graph. If you post a data set, you can proabaly get some direct help from people that like to do this sort of thing. Mike -
QUOTE (petersrule2003 @ May 4 2009, 08:52 AM) I am sorry, I overlooked the information about this being a serial comm setup. You should verify that the serial read operation is providing useful data by looking at that data directly. Wire an indicator or attach a probe to the output of the VISA Read. I can't see any data to review the conversion because I cannot run your application. The data is lost when you save the VI without making the data in the the various indicators default so it persists when you send the VI to us. All serial data is encoded in some manner and you have to decode it properly. If the serial read data is not correct, then you need to find out why, and I cannot do much to help unless you provide the data. You have a note that talks of a boolean array, but there is no boolean data. The data from the Read is string data. You are converting that in to a 32 bit integer. My best general advice to you is to remember that the graph is showing you exactly the information it was given, and showing it in the way you have told it to show. If the data is right and you set up the graph correctly (bring up the graph properties to change things) you will see the desired output. You can create a numeric indicator on any wire, do this on the wire that feeds the graph and look at the numbers directly to see if they make sense. You need to work your way back to where the data becomes good data and find out why it is not correct beyond that point. You can do this with probes and indicators in LabVIEW. This is normal debugging procedure. On the data source end of the exercise you should always have an oscilloscope to make sure you have a good understanding of the signal that is wired to the DAQ hardware. You can waste a huge amount of time thinking there is a programming issue when it is really hardware, wiring, and signal related. If the signal applied to the DAQ hardware is verified to be useful, and the serial output is not correct then you know the problem is in the DAQ card somewhere, or in the wiring (see the link to Field Wiring I sent earlier)
-
QUOTE (petersrule2003 @ May 3 2009, 01:57 PM) Looks like a much too low sampling rate (your rate should be 10 times faster than the frquency of the signal of interest). And a full wave would not go to zero, so there is something wrong with the way you are wiring it up. You can count on this: the graph is showing you the voltages you have applied to the terminals of the DAQ card. I bet it you put a real scope on the same points, using the same scale and sampling rate you will get the same sort of readings. Also, if you are putting -120 volts directly on the DAQ board (you did not mention which of the many possible DAQ boeards you are using) then you have destroyed it by now. If you have some signal conditioning in line with the signal you should share details about it. There is a paper on field wiring you should read: http://zone.ni.com/devzone/cda/tut/p/id/3344
-
QUOTE (iriszhaoyu @ Apr 28 2009, 07:31 AM) A simple way to do this: You can perform the basic math functions on arrays - add two arrays and they are added cellwise, New Array (0,0) = Array1 (0,0) times Array2 (0,0),...New Array (m,n) = Array1 (m,n) times Array2 (m,n). Also subtraction, multiplication and division. By creating a set of arrays like you have described in your image, you can then add them and divide the result by the scalar number of arrays added. You can create the new arrays by simply using delete array element to eliminate the first element of the original array, then the 1st element of the new array, and so on. Add them together and the first element of the first array is added to the second element of the second array, is added to the third element of the third array. Divide that buy the number of arrays and you have the average of the first n elements. I will give you an example that does this for an average of 5 elements, and I have included a VI that compares the effects of various filters in LabVIEW - Butterworth, Chebyshev, etc. This is very useful for selecting the best filter and finding (by trial and error) a set of coefficients that suits the needs of the anaysis. You can apply the filters overlaid upon the original data to intuitively examine phase shift, and so on. Mike
-
QUOTE (Pollux @ Apr 6 2009, 09:09 AM) The VI is doing only what you asked of it. Please investigate some example code on the use of the Event Structure. You will see that the event structure is always enclosed in a while loop structure. This is how it repeats more than one operation. When have an while loop structure you will need to create a means to stop the loop. I see also that you do not have the concept of wiring data. This is so very basic that is is hard to be of help to you. You need to start finding and using example code to learn how LabVIEW works. On the block diagram menu is a light bulb icon. This slows the operation and gives a visual means of watching the data flow through the program. You should use this and carfully observe how the graphical programming system works. Mike
-
QUOTE (raymyster @ Apr 6 2009, 08:07 AM) Yes, LabVIEW can do what you want. LabVIEW will do it much more easily than C++. But interfacing... I have not done that. I stick to LabVIEW. I do not see the point of lasers. You can use mechanical switches that cost a few pesos just as well. With a proper data acquisition and control system, you can sense and respond to continuously changing inputs which will be better for aircraft control. A binary system - hand blocking laser versus hand not blocking laser - is an ineffective way to control all but the simplest systems. How will you tell it to turn slowly or quickly? Your parallel port is not easily useful. It is a digital system. You can use use this for sending simple digital IO, but this is a misuse - alot of trouble with little payback. If you have a microcontroller that can send parallel information (bits, bytes, and words) then it is used properly. Only in this way can you get continuous control of the aircraft. Assuming you don't really want the trivial binary control, then you are essentially trying to replicate a joystick function - this is nothing new. There must be a ton of information about how to design a joytick and interface it with a PC. Look in some hacking sites on the web. There is probably C code to use. This will be more fruitful than persuing the LabVIEW connection. There may even be hobbyist joysticks to use. Look into radio controlled helicopters and aircrafrt for control hardware and software. LabVIEW is a full featured software development environtment. The learning curve is steep, but significant. It does not seem practical to me that you should be using LabVIEW for this small project. You should be learning your C++ to do this.
-
QUOTE (raymyster @ Apr 4 2009, 03:50 AM) So, what ideas do you have yourself on how you might accomplish this? Note on list etiquette: It is nice of you to be honest this is course work. But, even when it is not, it is still a good idea to have made your own contribution to the effort; the fact that it IS course work, and others may be working diligently without asking others to do it for them, makes it even more problematic to start throwing out solutions. It is even a fascinating topic. But, you really ought to lead with: "Here are my own ideas; 1, 2, 3, etc." "Here is how I am currently trying to do it..." "This is what didn't work." "I have no idea," doesn't really cut it. That is the starting point for so much project work. You need to get past that point on your own. IMO. Mike
-
QUOTE (ssteven121 @ Apr 1 2009, 07:18 PM) I imagine that ni phone support will help you sort this out. If you have access to them a phone call will be the quickest way to resolve the issue.
-
QUOTE (JustinReina @ Mar 30 2009, 12:31 PM) Justin, That is a very broad stroke. I know it was a throwaway comment, but I think it is unfair. I know too many working students and parent/students to feel this is a fair commentary. There are a lot of people who are slack, but it is not a fact of life for many. The un-slack are not obvious, you only see them in class, the lab, or the library; you don't see them when they are at work or at home caring for their family.
-
QUOTE (Zest @ Mar 30 2009, 05:13 AM) I hate to say it, but if your mark in the course comes to this "poster" and you have not learned what is necessary to figure it out on your own, maybe you have not applied yourself to the course work with due diligence in the months leading up to this point. I suppose the class could also be poorly conceived and unfair, but that is generally not the case when a passing or failing comes to barely succeeding in one last bit of panicky work. I doubt if LAVA can help you become a success in this case (the 20 hours has elapsed as well I think). I am sorry, and good luck next semester, Mike