Search the Community
Showing results for tags 'xygraph'.
Found 4 results
-
 Hi All, I am trying to plot three XY scatter data and move one against the others. It does work when I make a new x-axis and change the scales of one manually. However, when I try and use it programmatically, the numbers of the scale change, but the plots do not change, meaning the one that was moving is not anymore. I could just recalculate X values separately and replot every time I change scale, but I don't think that should be the only way to do this. Any help would be appreciated.
-
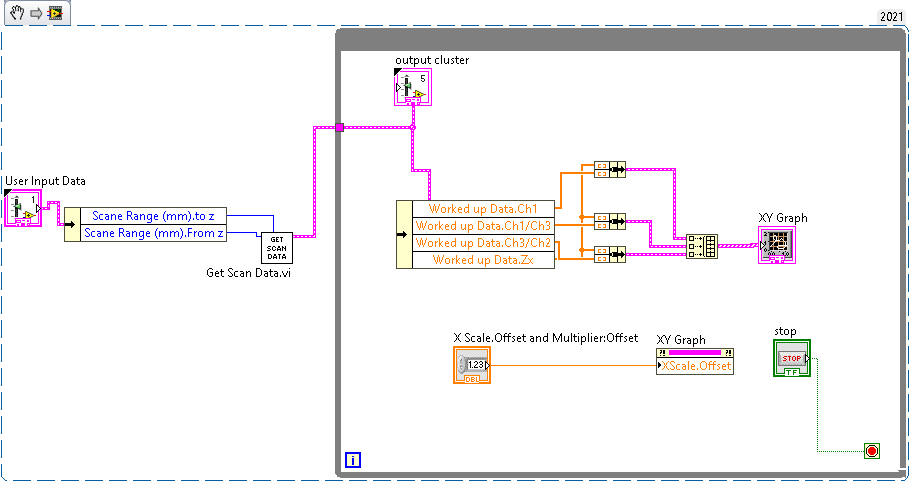
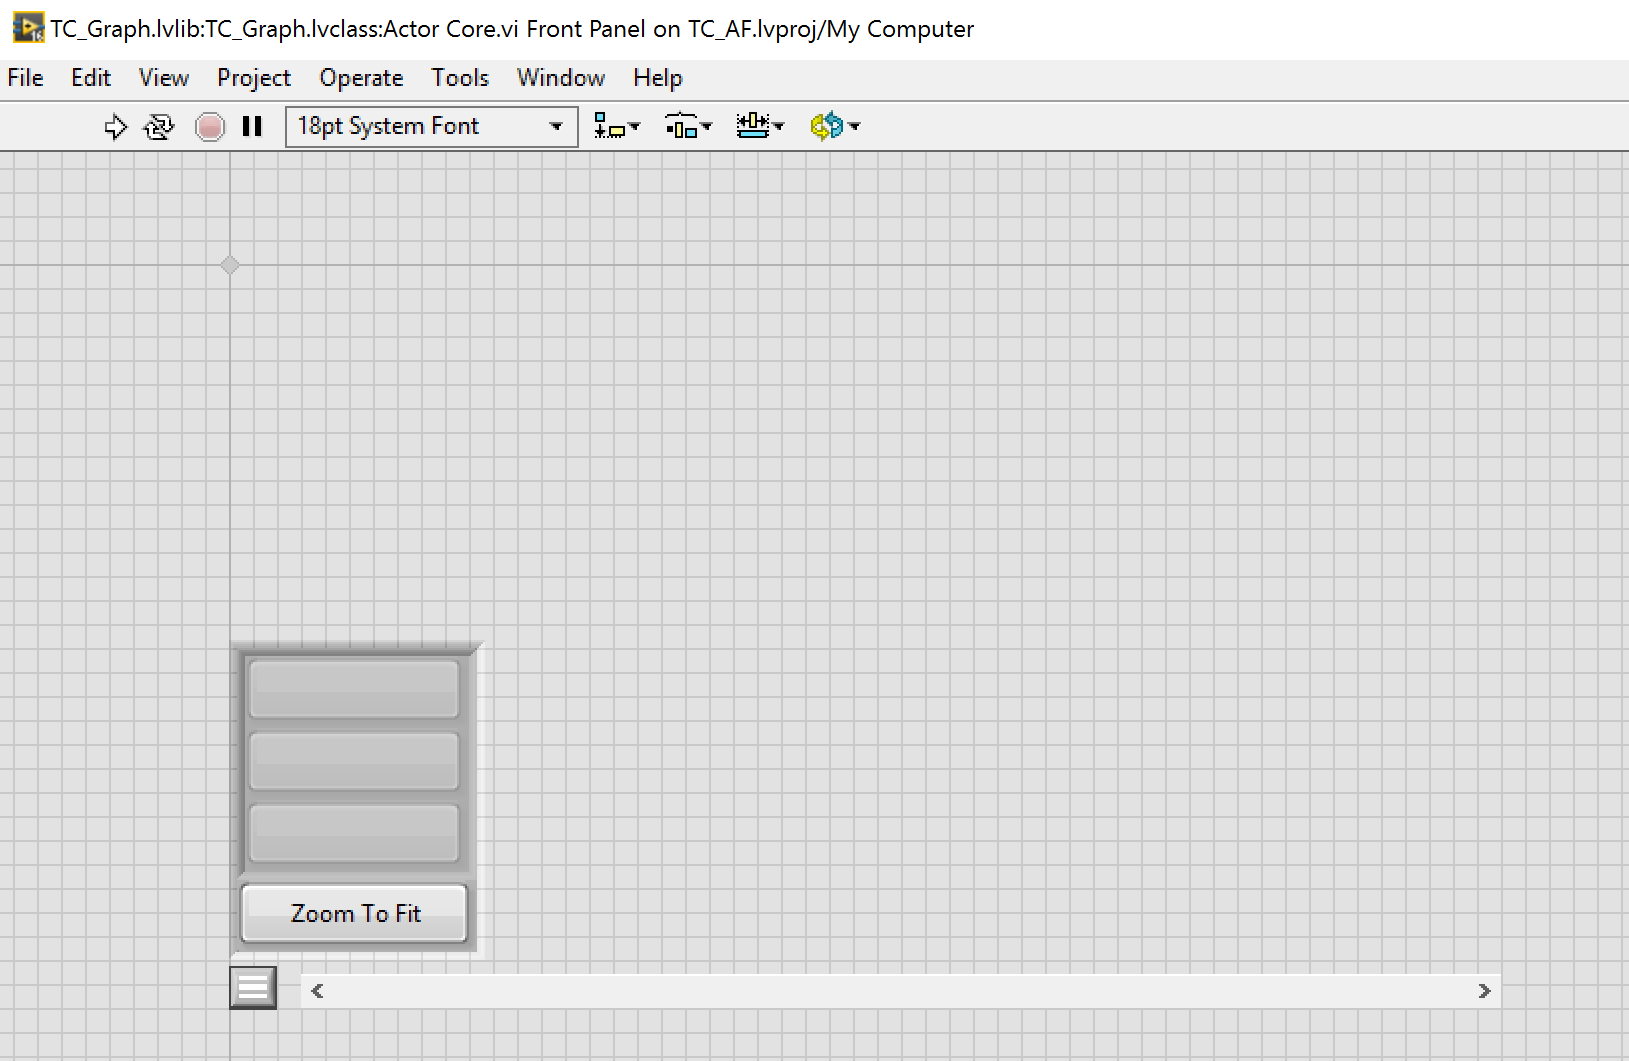
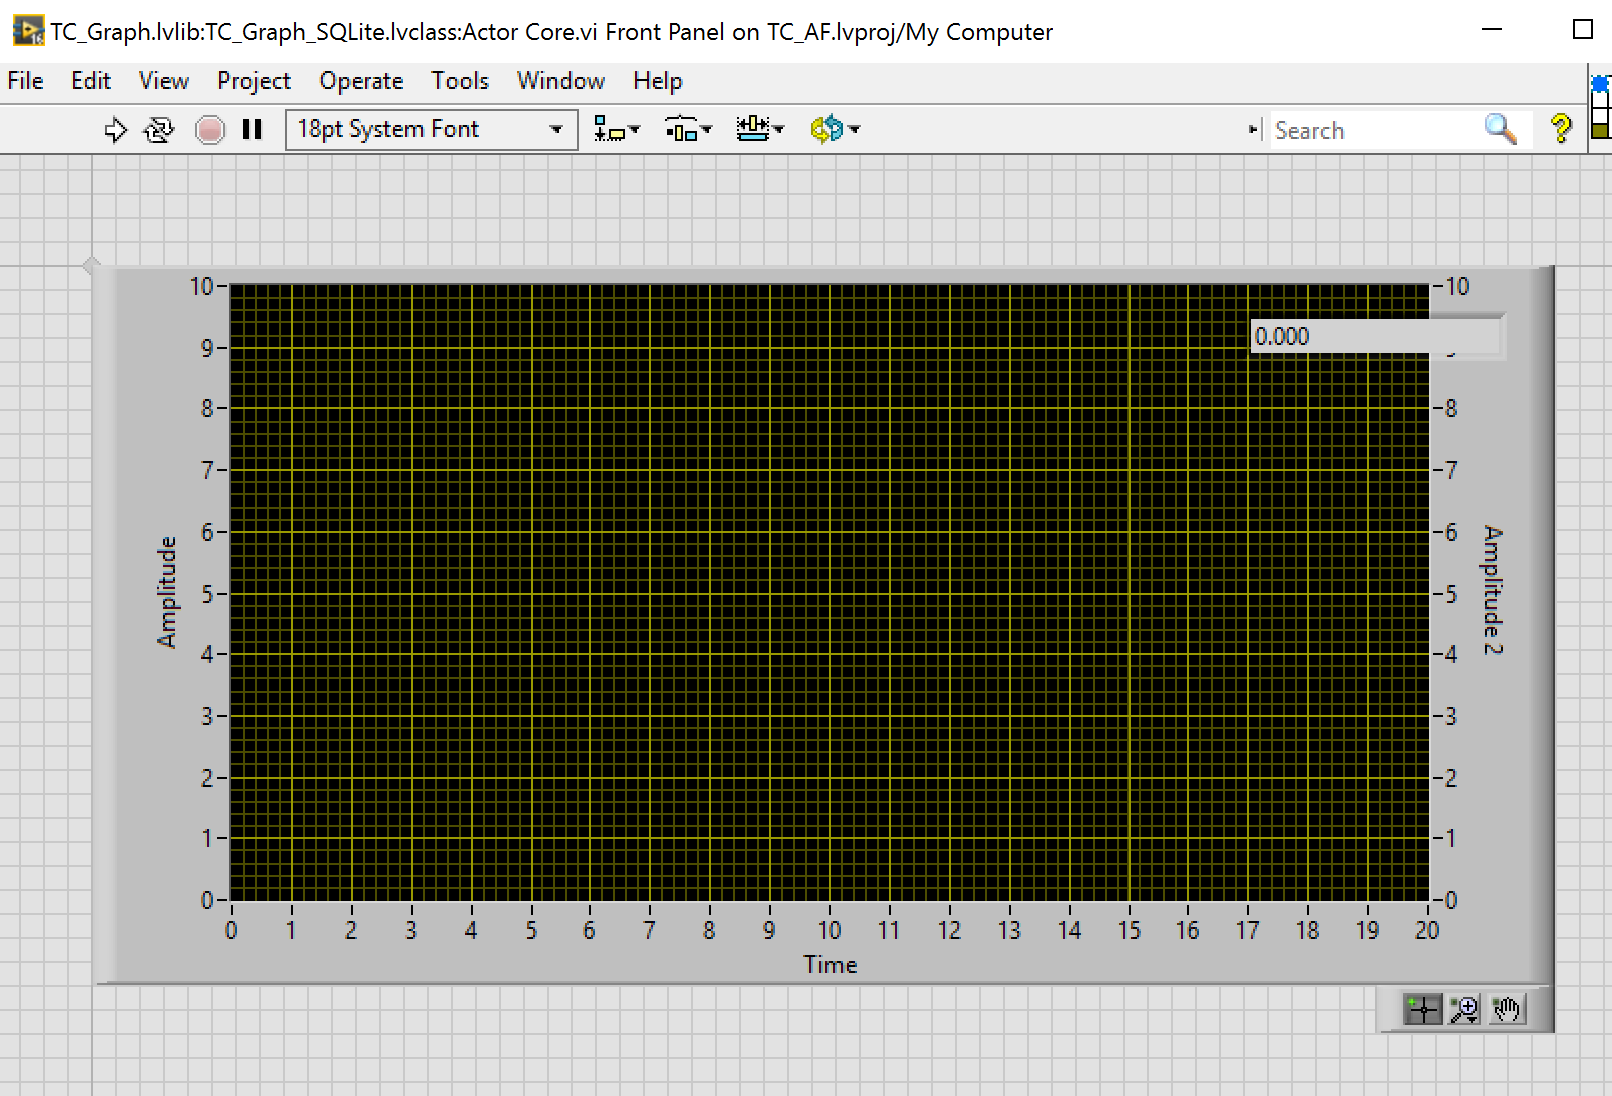
 I'm writing some LabVIEW software to store and display data from a variety of data sources, mostly through an NI DAQ board. I'm displaying the data (stored in an SQLite database) on an XYGraph. I would like to have a toggle-able, probably semi-transparent box listing each of the plots on the graph, with the option to turn the plots on/off by clicking, along with some grouping of similar plots (all temperature measurements, or all measurements from experiment #5, etc). The Bloomy post at http://www.ni.com/newsletter/51918/en/ gives me semi-transparent panels pretty easily (in fact, this can conceivably be tri-state, since I have on, off and invisible :D) I've already programmed a simple multi-column listbox for something else in this project that switches symbols and handles double-click, mouse up/down, etc, so I could maybe use a modified version of that to hold my plots. I have never successfully used an XControl for anything, but when I come to problems involving collections of strange custom controls, I always think, is this what an XControl is for? So, do I need an XControl here? Or will I just be diving into another rabbit-hole leading to yet another unsuccessful XControl attempt? If so, what should I be using instead? In case it matters, the bulk of the project uses NI's Actor Framework to handle separate sections, and the graph is inside a subpanel, inside another subpanel. Some images of current pieces. The parent holds the scrollbar, and my current no-op (except show/hide on the little menu button bottom left) overlay (not at all transparent). The child holds the actual graph, and an ugly global variable mean (I needed it quickly for a colleague's use...). The child is embedded in a subpanel of the parent (above the scrollbar) and the parent is embedded in a subpanel of the MainUI's 'Actor Core.vi'.
-
Hello, In matlab the plot data can be save as a *.png,*.jpeg, and so on and even a pretty good option *.fig. Later when the *.fig is opened you have the real plot as before and this can be edited like changing the legeng , x and y labels, color of the plot etc,. Is there any option like this in labVIEW. I have seen options like saving the data into excel and to different image formats. Is there any special tool kit or add in functions??
-
Hello to everybody, I'm wondering to find a solution to this problem... I have an xy-graph and I would like to insert programmatically some text label connected to certain x-y coordinates of the plot itself. Does somebody know if it is possible? ... and have an idea on how to implement such behaviour? Thanks Max