Search the Community
Showing results for tags 'debug'.
Found 7 results
-
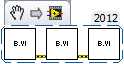
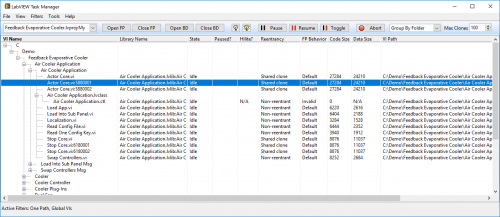
View File LabVIEW Task Manager (LVTM) LabVIEW Task Manager v1.10.0 (for LV2013+) This code is Open-Source, and free of charge Authors: Ravi Beniwal, Tim Vargo LAVA Names: Ravi Beniwal, TimVargo Contact Info: Contact via PM at the LAVA site (http://lavag.org) LabVIEW Versions Supported: LV2013 and up LabVIEW Versions Tested on: LV2017 LV2016 LV2013 Dependencies: GPower Error & Warning = 1.2.0.14 lava_lib_tree_control_api >= 1.0.1-1 NI SmartBalloon = 2.0.0.2 OpenG Application Control Library >= 4.1.0.7 OpenG Comparison Library >= 4.0.0.3 OpenG Array Library >= 4.1.1.14 OpenG Error Library >= 4.2.0.23 OpenG File Library >= 4.0.1.22 OpenG LabVIEW Data Library >= 4.2.0.21 OpenG String Library >= 4.1.0.12 LAVA Palette >= 1.0.0.1 Description: LabVIEW Task Manager is a debugging tool for use during LabVIEW code development. An expandable/collapsible tree diagram displays detailed information (both static and dynamic) on all VIs in memory, belonging to a selected project/target. It allows for interacting with single or multiple selected VIs at a time, and includes the following major features: Selection of project/target Lists all VIs in memory, grouped by class/library or disk folder, or a flat list Searches for and enumerates clones in memory DropIn VI for including dynamically referenced clones (Clone Beacon) 'Refresh Now' (F5) re-reads all VIs in memory and adds new ones to the tree Displays VI name, owning class/library, state, path, data size & code size Displays VI FP Behavior, Reentrant?, Reentrancy Type, Paused? & Highlight? Group by Class/Library or Folder, or display a Flat List Sort by any column, ascending or descending Filter out item types vi, ctl, and vit/ctt Filter out vi.lib and global VIs Filter out items from being displayed, per folder paths. Tracking of, and ability to toggle, execution highlighting on multiple selected VIs Tracking of paused VIs with ability to Pause/Resume/TogglePause multiple selected VIs DropIn VI for pausing only while debugging If a clone initiates a pause, a different pause symbol is used for all clones of that same reentrant original VI Select multiple VIs and open or close their FPs or BDs Double Click a VI from the tree to bring the BD (first choice) or FP to front, if already open Select multiple top-level VIs and Abort them Remotely close any VI's Front Panel Installation and Instructions: Install this tool by using the VI Package Manager to install its associated package file (.vip). Installation requires VIPM 2014 or higher, which is available for free from jki.net (http://jki.net/vipm). Invoke the LVTM tool from your dev environment menu: Tools > LAVA > LabVIEW Task Manager Known Issues: Cannot abort SubVIs launched from remote VI Server or local Asynch Call By Ref Submitter TimVargo Submitted 07/01/2014 Category LabVIEW IDE LabVIEW Version
-
 Hello all, background A while ago I wrote a dll wrapper to get data from dedicated test-hardware. For this hardware there is a dll available. To use this dll you need to use an callback function. If you need to use a dll in Labview which needs a callback you need to write the callback in C code and use a Labview C lib to get the data into Labview, basically my dll takes care of this problem . Enhance the code and way of working more efficient The code I wrote code works fine. However I did not use / test it for hours on a row. And sometimes If I make a mistake when changing the code I run into problems. I was able to fix all the errors and problems however it was not the most efficient way of working. For instance If there is a serious error in the code the dll I need for the hardware can crash, it can make my wrapper crash, which will in return make Labview crash. This makes the way of coding inefficiënt and it will not enable me to read my C++ book etc etc. Example pseudo code I did try to extract some main points of intrest from the code, I did add some comment in the code. I hope someone can give me some general guideline or advice what to read. At this time I am reading: Unhandled C++ exceptions I think I might be able to use it, I did not use this before so advice would be welcome. Thank you all for the help ! // .. // This is a part of the code only intended to have a talk about how to catch errors // It is not complete and intended as Pseudo code // .. int __stdcall MyDriverLoads(const int NumberToInitialise,const bool enableAnotherOption , const char *const path , LVUserEventRef *rwer) { // loads the dll // Q -- I can check if (F_functionname !=0), if it is not 0 then I can proceed if the function returns 0 I can return an error to Labview Extern_dll = Load_Extern_dll(); // Get the functions I need from the dll p2_ExternDriver F_ExternDriver = (p2_ExternDriver)GetProcAddress(Extern_dll, "_ExternDriver"); p2_Initialise F_Initialise = (p2_Initialise)GetProcAddress(Extern_dll, "_Initialise"); p2_AdapterCount F_AdapterCount = (p2_AdapterCount)GetProcAddress(Extern_dll, "_AdapterCount"); p2_StartLogging F_StartLogging = (p2_StartLogging)GetProcAddress(Extern_dll, "_StartLogging"); p2_StopLogging F_StopLogging = (p2_StopLogging)GetProcAddress(Extern_dll, "_StopLogging"); // When there are adapters found I tell it in Labview adapterCount = F_AdapterCount(); // Get the callback function adress, if adress == 0 I can see something is wrong void(__stdcall *p2_CallbackFunction_t) (pt2Obj , const LogData & ) = &CallbackFunction; // Q -- I could use try {} and catch {} however I do not have acces to the source code of the dll so, // I do not know if they used // trow "The Blue error" , or // trow "The Red error" ret = F_ExternDriver(adapterCount, enableLogFile, path, *p2_CallbackFunction_t, pt2Obj); // This tels the dll to start logging before this command you will not receive data in Labview ret F_StartLogging(1,2,3); // Labview is receiving data thats great !!! return ret; // Q -- Labview has been receiving data for a hour what happens if the used extern dll crashes ?? // If the dll crashes when return is passed I can not use try() and catch anymore. // } extern void __stdcall CallbackFunction(pt2Obj , const LogData & ) { // There is a lot to do here // do stuff!! // I did not write everything here err = PostLVUserEvent(*event_ref, &tmpEvent); }
 -
Version v1.10.0 (for LV2013+)
3,656 downloads
LabVIEW Task Manager v1.10.0 (for LV2013+) This code is Open-Source, and free of charge Authors: Ravi Beniwal, Tim Vargo LAVA Names: Ravi Beniwal, TimVargo Contact Info: Contact via PM at the LAVA site (http://lavag.org) LabVIEW Versions Supported: LV2013 and up LabVIEW Versions Tested on: LV2017 LV2016 LV2013 Dependencies: GPower Error & Warning = 1.2.0.14 lava_lib_tree_control_api >= 1.0.1-1 NI SmartBalloon = 2.0.0.2 OpenG Application Control Library >= 4.1.0.7 OpenG Comparison Library >= 4.0.0.3 OpenG Array Library >= 4.1.1.14 OpenG Error Library >= 4.2.0.23 OpenG File Library >= 4.0.1.22 OpenG LabVIEW Data Library >= 4.2.0.21 OpenG String Library >= 4.1.0.12 LAVA Palette >= 1.0.0.1 Description: LabVIEW Task Manager is a debugging tool for use during LabVIEW code development. An expandable/collapsible tree diagram displays detailed information (both static and dynamic) on all VIs in memory, belonging to a selected project/target. It allows for interacting with single or multiple selected VIs at a time, and includes the following major features: Selection of project/target Lists all VIs in memory, grouped by class/library or disk folder, or a flat list Searches for and enumerates clones in memory DropIn VI for including dynamically referenced clones (Clone Beacon) 'Refresh Now' (F5) re-reads all VIs in memory and adds new ones to the tree Displays VI name, owning class/library, state, path, data size & code size Displays VI FP Behavior, Reentrant?, Reentrancy Type, Paused? & Highlight? Group by Class/Library or Folder, or display a Flat List Sort by any column, ascending or descending Filter out item types vi, ctl, and vit/ctt Filter out vi.lib and global VIs Filter out items from being displayed, per folder paths. Tracking of, and ability to toggle, execution highlighting on multiple selected VIs Tracking of paused VIs with ability to Pause/Resume/TogglePause multiple selected VIs DropIn VI for pausing only while debugging If a clone initiates a pause, a different pause symbol is used for all clones of that same reentrant original VI Select multiple VIs and open or close their FPs or BDs Double Click a VI from the tree to bring the BD (first choice) or FP to front, if already open Select multiple top-level VIs and Abort them Remotely close any VI's Front Panel Installation and instructions: Install this tool by using the VI Package Manager to install its associated package file (.vip). Installation requires VIPM 2014 or higher, which is available for free from jki.net (http://jki.net/vipm). Known Issues: Cannot abort SubVIs launched from remote VI Server or local Asynch Call By Ref -
 Hello to all. I am deploying an executable (not installer) in a target PC with the same programs (labview and toolkits) installed than the development machine. When I create executable I uncheck the option "enable debugging" (see image below): ** In the image "enable debugging" is checked but I uncheck in my application. Then I am trying to debug in run time and of course I can not. I do this to make me sure that the user can not get my block diagram. But now I realized that in .ini file that Labview creates with executable there are these options: DebugServerEnabled=False DebugServerWaitOnLaunch=False So if user writes "true" in these options, can they debug in real time and because of that get my block diagram? Thanks a lot!
 -
Hello All, Long time reader, first time poster. I have learned a lot from lavag, and really appreciate what you all do here. I am building an LVOOP architecture that sort of straddles the line between AMC and AF. One of the most frustrating things I have run across (as with most AF type architectures) is debugging shared clones. I've run into some behavior that I did not expect and wanted to see if anyone knew what was going on. First some definitions: Behavior A: Opening a Shared Clone Reentrant subVI from the block diagram of a running VI opens the original, "uncloned" VI, reserved for execution. Behavior B: Opening a Shared Clone Reentrant subVI from the block diagram of a running VI opens the active, running clone VI, which is capable of being debugged. I once thought that behavior A was how LabVIEW worked, however in developing this framework, I have found that some subVIs show behavior B. Behavior A and B seem to correlate to dynamic and static dispatch methods respectively, but I can't make sense of why. If I create a simple example without OOP (see attached), I get behavior A. Has anyone ever seen this behavior, and if so, am I missing something really obvious? Secondly, does anyone have any tricks or best practices for getting into active clones to debug? My only idea at this point is to include some sort of notifier/queue/etc to active a Front Panel Open Method. Thanks in advance! Drew T. CLA, CTA
-
Hello, I'm developing an application that uses some PCIe hardware. My daily developing computer is a laptop docked to a dock station. Now, I would like to develop testing my subVIs in the remote desktop that has installed the PCIe hardware. I know I can enable remote debugging, compile and transfer the executable, then execute and connect from my laptop, but this is very inefficient and slow process to test subVIs. I could install the full development environment in the remote desktop, develop in this machine with remote connection (or even directly on this computer, as it's next to my laptop), but this is not the way I would like to work with every similar project. Do you have any better approach to debug remote desktop applications? I have heard something about using VI server and executing remote panels or similar, but I have never done such a thing. Any comment is welcomed. Thank you.
-
I am working on a tiny debugging tool. Say, we have a 2 vis, A.vi and B.vi. A.vi calls B.vi in multiple places on the BD. B.vi is being executed now. I would like to get the reference to the node on the block diagram of A.vi of a particular B.vi being executed right now (It may be paused, or just running). Same way as we get clickable "stack trace" drop-down list on a breakpoint. How can I accomplish it? A.vi BD: 1. If B.vi is reentrant, I could have used clone #. But if B.vi is not reentrant? 2. I can easily get an array of nodes of type "subVI" on A.vi BD. But the node does not have any property to show it's state (reserved, running, idle, bad etc). 3. Each VIRef of each subVI node has different numerical value. However, I was not able to find a VI property that would give me the distinction between a running VI and a reserved one. 4. I enabled supersecretprivate key in the ini file, but still no methods/properties I can use.