Search the Community
Showing results for tags 'report generation'.
Found 3 results
-
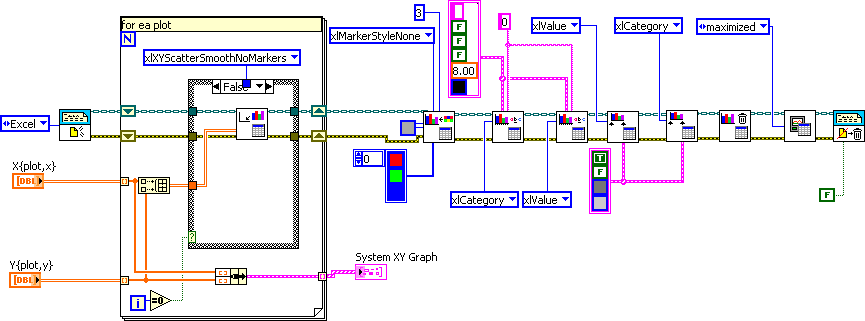
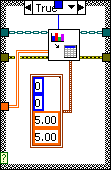
I'd like to make true XY graphs in Excel, where each data series has its own set of X values and Y values. Unfortunately, interleaving rows of X data, Y data, X data, Y data, etc., won't do it: only the first row counts as X data. And "updating graph data" as shown in this block diagram, doesn't work like I'd hoped. That VI should be called "overwrite graph data" not just "update". Am I overlooking something in the Report Generation toolkit? Ultimately, what I really want is to print an XY graph and have the printout scale to fit the page, be oriented nicely, etc. Saving the graph as a .PNG programmatically is cool and all, but the Windows program to view PNGs doesn't print well. Right-clicking the graph and saving to a .BMP leads to similar issues. Right-clicking and exporting the data to Excel allows me to laboriously construct an XY graph data-series by data-series, which then prints nicely. Keyword: laboriously. Suggestions?

-
Name: HTML color table Submitter: Benoit Submitted: 14 Jan 2016 Category: *Uncertified* LabVIEW Version: 2011License Type: BSD (Most common) This VI allow an easy way to create HTML color table in the LabVIEW report generation toolkit. This VI should be connected to the "Append User Formatted HTML to Report.vi". For this version, all the column are the same size. But alignment and color of each cell can be defined. Please rate this file if you download it. It's free... you can at least give some second of your time to rate it... I spend some hours to make it... Enjoy Click here to download this file
-
Version 1.0.0.1
223 downloads
This VI allow an easy way to create HTML color table in the LabVIEW report generation toolkit. This VI should be connected to the "Append User Formatted HTML to Report.vi". For this version, all the column are the same size. But alignment and color of each cell can be defined. Please rate this file if you download it. It's free... you can at least give some second of your time to rate it... I spend some hours to make it... Enjoy-
- 2
-

-
- html color table
- report generation
- (and 2 more)