Search the Community
Showing results for tags 'waveform chart'.
Found 4 results
-
Hi folks, I need to know if this is possible? if yes then the what are the possibilities?? 1. The user should select the signals (by check box or similar). 2. My waveform chart should display only these signals on the front panel. (no of signals in the waveform chart must be modified based on this signals). 3. it is better, by clicking a button the new front panel pops up with waveform chart.
-
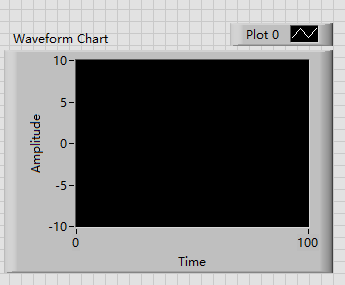
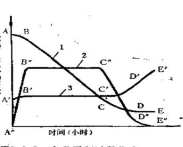
Hello, everyone! I have a question with the waveform chart(figure 1). How can I plot multi curves in a waveform chart in sequence (figure 2)? For example: 1. I plot the first curve which the starting point is 0. 2.I stop the program or press a button, then the second curve plots from the starting point at 0, too. 3. And so on, I can plot some cures in the same waveform chart. I am looking forward to a reply, thanks for your attention !

-
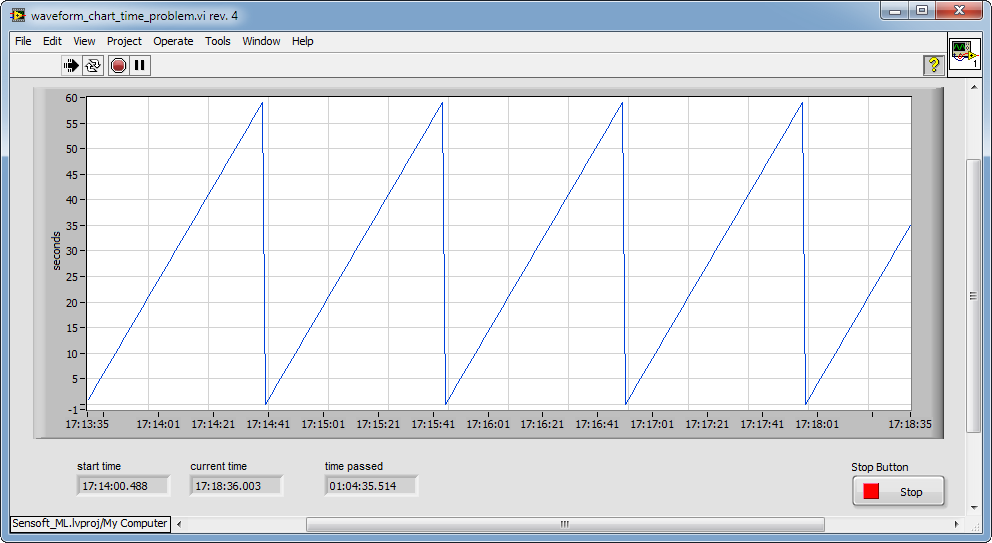
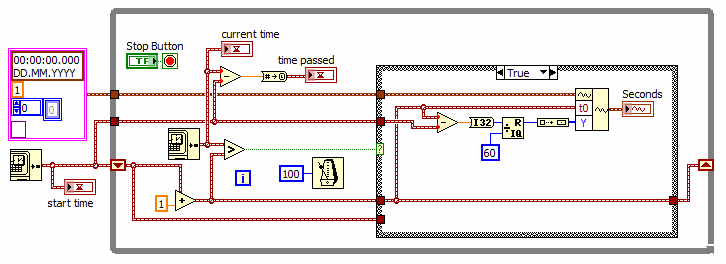
 Hello, I am experiencing some problems with the time scale of a Waveform chart. I am using LabVIEW 2012 SP1 on a Win7 PC. The vi here attached updates the waveform every second and shows on the Y scale the seconds passed (modulo 60). The graph seems to flow more quickly as the X scale. After 4 minutes and 35 seconds the graphs is shown full, but the X scale is 5 minutes. What is going wrong here? Is there a problem with the code? An additional question is why the difference of the current time - initial time gives: 1 hour, 4 minutes and 35 seconds while it should be only 4 minutes and 35 seconds? Any hint is welcome. waveform_chart_time_problem.vi
-
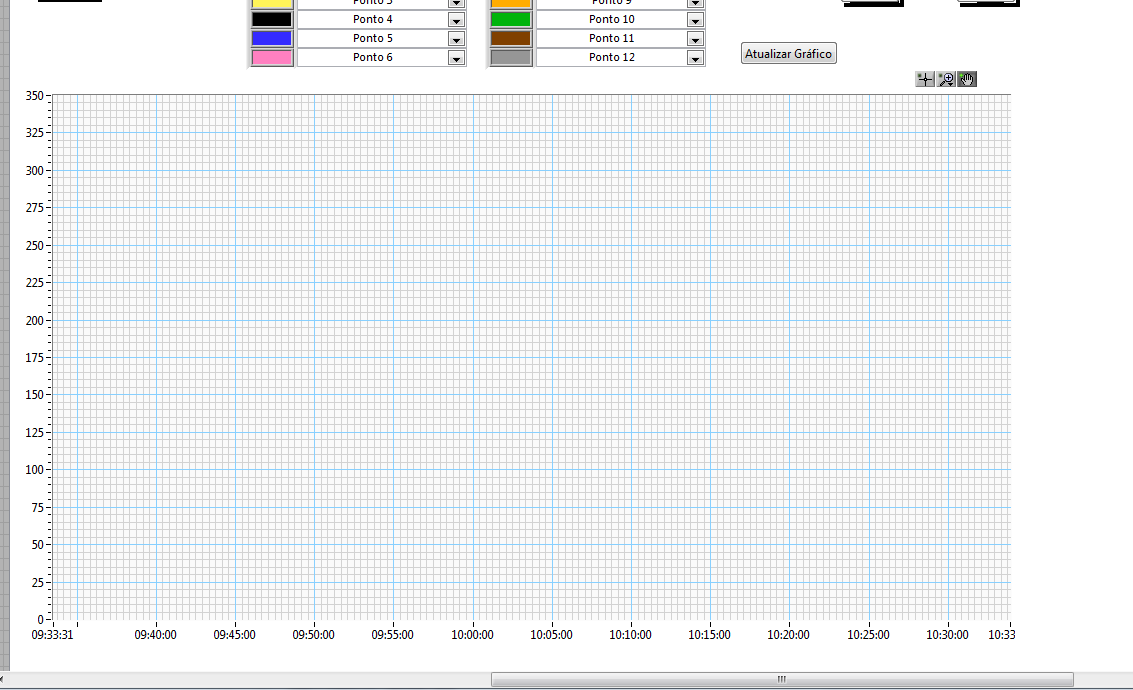
Hi guys. I am new here and Labview, sorry for my english wrongs. I am from Brazil. So, i try have an absolute time in x scale, from my waveform chart, but the VI don't execute this. I wish make like the picture in annex. It´s the only problem in my project. I Use Labview 8.6 version. Please help me