Leaderboard


Popular Content
Showing content with the highest reputation on 12/16/2011 in all areas
-
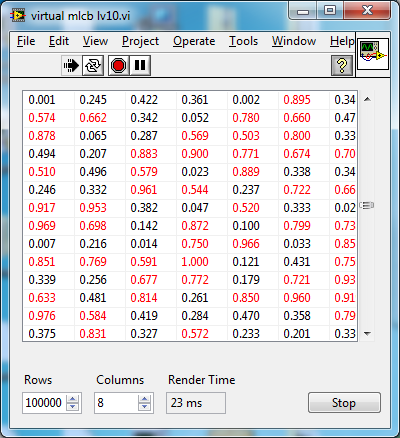
One of my UIs has a problem where it can chug down if you throw too much data at it. The underlying problem is formatting I'm applying to a native LabVIEW multicolumn listbox (MCLB). I'm not aware of any way to get events out of the MCLB when an item is scrolled into view, etc, so the application just blindly applies formatting to the entire list. Not a problem when I wrote the application because the data set was at most bounded to perhaps 1000 rows. Being in R&D, we're never happy though and my colleagues who use the application started throwing data sets at it that can have something like 100 000 rows. Yeah, the UI bogs down for minutes at that point, even with UI updates being deferred etc. Simply performing hundreds of thousands of operations on the MCLB even with no UI updates takes patience. Now ideally I'd like to have better support for the native MCLB, but for now I need to work with what I got so I figured I'd kludge together a pseudo virtual MCLB in native G-code. Here's a proof of principle: virtual mlcb lv10.vi If you run the VI and generate some stupidly large data sets, say 100000x8, you'll see that the render time hopefully stays constant as you scroll through the data, and with a little luck is reasonably fast. Now if I could make a virtual tree view...
 2 points
 -
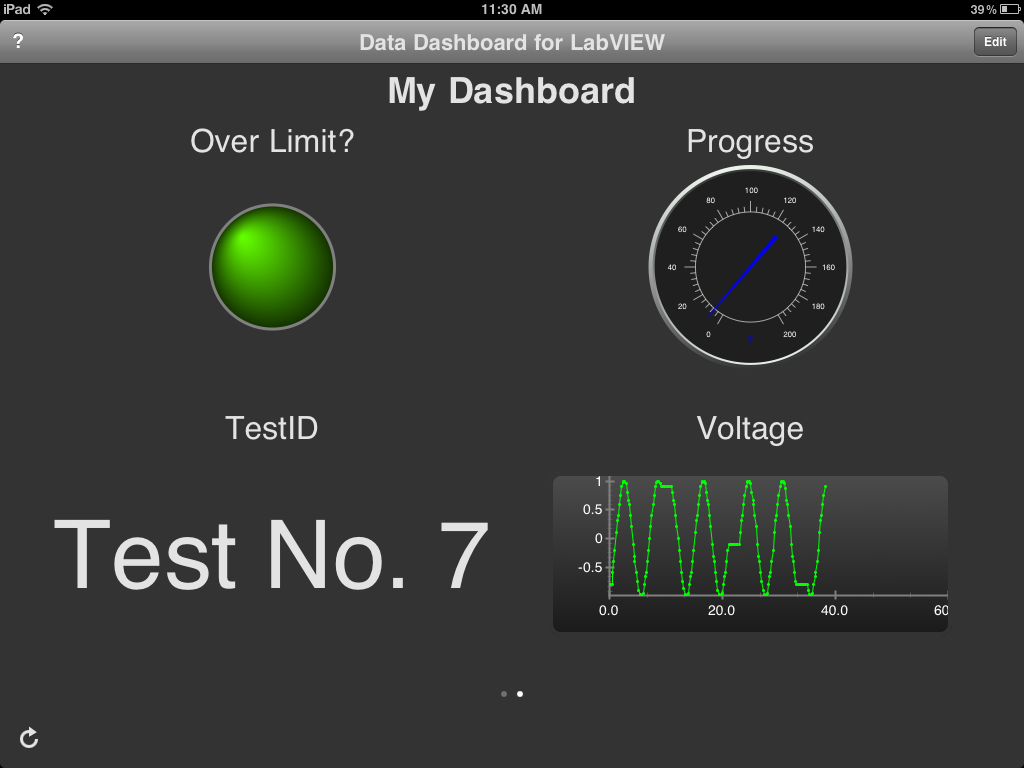
I'm excited to finally be able to tell you all about the project I've been working on since NIWeek. Thanks to the success of the iPad in the last two years tablets have become very common. They're more convenient in many cases than laptops, and an increasing number of people are carrying iPads or other tablets around instead of a full blown computer. You can do a lot of things with a tablet, but there are still some gaps, and access to your LabVIEW applications has been one of those gaps until now. Data Dashboard for LabVIEW is a FREE tablet application which gives you a simple, intuitive interface to quickly connect to and display data from a network published shared variable and/or LabVIEW web service. If your application publishes useful data through either of those mechanisms then you can show it on a tablet from anywhere. Data Dashboard supports scalar integer and floating point numeric, boolean, and string data types and four controls: text, chart, gauge, and LED. You can connect to up to 6 variables/web services at a time on a single page, and you can have multiple pages to connect to different sets of data. Data Dashboard is available in the iOS app store (for iPad only) and the Android Market (for Android 2.3+ tablets, not phones). Also coming soon to the Amazon App Store. You can read more about the application here: https://decibel.ni.c.../docs/DOC-19387 Please give it a try and let me know what you think.
1 point