

george seifert
-
Posts
399 -
Joined
-
Last visited
-
Days Won
2
Content Type
Profiles
Forums
Downloads
Gallery
Posts posted by george seifert
-
-
There is your first problem right there. Try building it in 8.6. Keep us updated.

After 2 hours I finally stopped it and restarted. This time it proceeded along and was waiting for input regarding the location of files (I hadn't run the installer since getting a new PC and loaded everything). I suspect the first time that that dialog box may have been hidden and that's what was holding things up.
George
-
I started an installer build with LV 9.0.2 1.5 hours ago. I can't take anymore coffee breaks. I know builds take a ridiculously long time, but this is really nuts.
I sure wish the build status window would actually show something. Mine has always been blank when building an installer. Does that happen to anyone else?
George
-
I'm guessing this isn't an option, but if you can get them to approve having a virtual machine, it will probably simplify your life considerably, because then you can install one version on each VM and not have to deal with all the cross installation issues.
Pros:
- Simplifies things (only one version on each machine, and that includes things like MAX and drivers. This is great when you need to support an existing project).
- You can back up the VM after you installed what you want, so if you ever screw it up, you can immediately get it back to a safe state.
- Similar to the last, you can start with a base machine configured with all the stuff you need (SCC, etc.), then make copies of it and install the specific stuff.
- Sun's xVM is free and works great.
- IT probably won't approve it.
- License issues (OS, LV).
- Takes up hard drive space.
- Might have issues with hardware (USB, PCI, etc.).
Interesting. I never knew that about VMs. That would sure be nice for support of old projects.
What are the license issues?
George
-
Slightly off topic, but why would IT want to move to Vista and not Windows 7? I keep hearing nothing but good things about 7 and we all know what Vista was like.

Because they spent 4 years approving Vista and they don't want to waste all that work I suppose. By the time they knew Vista was no good too much work had been done. They'll probably get started on 7 soon and it'll take another several years before they're ready to bless that. From what I've heard of Vista we're probably better off just scraping it and stick with XP until they've blessed 7. Ah the joys of a big company and FDA requirements.
-
If your new PC is coming with Vista, bear in mind that the NI only supports LabVIEW 8.5+ on Vista.
We're still on XP, but Vista is coming soon (it's takes forever for IT to approve a new system). But it's good to know about the limitations. I never really paid attention to that before.
George
-
I need to load some old versions of LV, but just found out I didn't save the disks from the oldest version I need (7.1). Can that be downloaded from NI if my serial number hasn't changed since then?
George
-
Bite the bullet. Start from the earliest version and work your way up. I've done it both ways a few times and going from most recent to older had some problems. I don't remember any trouble at all installing oldest to newest.
Thanks. I was afraid of that. Oh well, lots of coffee breaks.
-
I'm getting a new PC at work and in some ways am dreading it. I'm going to have to reload LV and I think it's going to take days. I will probably need to reload at least a couple of old versions 8.6 and 7.1 and am wondering what order to do this. Can I load 2009 and then load old versions as needed or is it better to bite the bullet and start with the old versions and work my way up?
George
-
George,
It is interpolating the data. From the detailed help for the Waveform Peak Detection.vi:
Locations contains the index locations of all peaks or valleys detected in the current block of data. Because the peak detection algorithm uses a quadratic fit to find the peaks, it actually interpolates between the data points. Therefore, the indexes are not integers. In other words, the peaks found are not necessarily actual points in the input data but may be at fractions of an index and at amplitudes not found in the input array.
What's wrong with the Threshold Peak Detector that you also have dropped on your diagram? That should give you the correct results.
-Scott
I can understand if found a point that was actually within the data set, but the peaks it found are all greater than actual points in the data set. The max value in the data is 1.3, but it returned 1.43 as the max. How could an interpolation come up with that value?
The Threshold Peak Detector I have doesn't return the same data as the Waveform Peak Detector. The Threshold Peak Detector returns values at the start of the ramp whereas the the Waveform Peak Detector returns the peak (or in my case - values beyond the peak).
I also noticed that the locations given of two of the peaks are way off. One is way beyond the peak. I thought maybe I could use the location to give me the peak amplitude instead of using the interpolated amplitude, but that method gives even worse values. This VI is totally worthless.
George
-
Could someone else please run the attached VI (LV 2009) and see what results you get? This is a VI where I'm generating a waveform so that I can test some detection methods. I was very surprised to see the values that the Waveform Peak Detection VI returned. It should return 3 peaks at 1.0, 1.3 and 1.1 since that's what I generated. It returns 1.1, 1.43 and 1.21. What the heck's going on?
George
-
Just out of curiousity, but why would you think about sending references to the clusters instead of the actual data itself? It just seems kind of complicated to send the references.
I'm not sure why you say it would more complicated to send the references. Just right click on the cluster to create a reference and send that. It seemed a little cleaner.
I wasn't sure which way would be faster, create fewer data copies, etc.
George
-
If by "references" you are refering to control references, then pass the data.
Ben
Yes, I meant the control references. And thanks.
George
-
Sorry, I'm sure this is covered somewhere, but a quick search didn't find it.
I need to send data from one loop to another. I'm going to generate a user event so the second loop can use a dynamic event to respond to the incoming data. Is it better to send the actual data (which consists of a few clusters with about 10 components in them) or references to the clusters?
George
-
Thanks for all the suggestions. Been busy with other stuff. I need some time to digest the suggestions.
George
-
If you can define the trough as a rising, falling edge or it drops below a certain level, you can get the analogue card to trigger aquisition. Take a look at
Acq&Graph Voltage-Int Clk-Analog Start w Hyst.vi in the examples and see if it will suffice.
I'd still need an absolute level for this to work. I can't be certain of an absolute level. All I know is that there is a trough followed by a rise of 150 mV.
George
-
I expect you're looking to use a circular buffer to hold the last N seconds of data. You'd perform the analysis on the buffer which would include the last data acquired.
Right, but reread my second paragraph. Analyzing the buffer and the timing of when I grab the buffer is the issue.
George
-
I'm just looking for something to spark something in me to get me going in the right direction. I need to find a valley that occurs just before a 150 mV rise in the signal. After that I need acquire data for several more seconds. The signal before the valley will be slowly falling and the rise after the valley will be somewhat sharper. There is no absolute value I can look for - just the valley.
I figured I'd need to continuously sample the DAQ channel and then grab fixed chunks of the buffer and examine the buffer. The problem with that approach is that I might grab a portion of the signal that contains the valley but not the full 150 mV rise. In which case I would miss it.
Any ideas would be welcome.
George
-
You need to use the RTSI.
I think that only applies to multifunction boards and not the DMM.
Geroge
-
I posted this at NI with no luck. Hope someone here can help out.
I need to get continuous measurements with a PXI-4071 DMM (current measurement) and a PXI-6254 DAQ (voltage measurement) but I can't figure out how to synchronize the two measurements. I'll be sampling continuously and reading the buffer at reqular intervals to compute a running average energy so I need the two measurements to line up in time. It's possible (but not as desireable) to get the current measurement with the DAQ, but the DMM would give us a better measurement. The only way I can see to come close to what I want is to trigger both measurements, but then there will be a gap in the measurement while I read the data and setup for another trigger.
George
-
Yeah, that's the only thing that works so far. It'd be nice if there was a property for that though.
George
-
I have 3 graphs arranged vertically that I want to display the same fixed plot area. The left edge of the graph (where the y axis labels are) moves depending on y scale (I need the scale to autoadjust). I can't seem to find a property node that will keep the left edge of the plot area in a waveform graph from self adjusting. I tried Plot area/Size/Width but that wasn't it. Is there a way to keep that edge from moving?
George
-
I just can't get used to the new editor. Mark Balla's worked great and it did all I needed. Just wondering if anyone has tried it with 2009 since it says it only works with LV 8.x.
George
-
- Ourcode conventions say that when we insert something like that on yourdiagram, you should see a load warning when you load the VI explainingthe change. Did you get such a warning? If not, please file a CAR.
- Generallythis would be done for any node that used to silently fail some caseand in the new version it returns an error code for that case. Existingcode may have been written to assume the silent failure. To preserveprevious version functionality, we insert a function to conditionallyclear the new error code.
- Inserting a full "Clear Errors.vi"that wipes out all error information would be strange... The only caseI can imagine that applying to is if in the previous version the nodeutterly failed to propagate error in to error out and we have fixedthat, but, again, to preserve previous functionality, we clear allerrors downstream. But that's just a guess. [LATER] Looking closer atyour posted picture, that is just a conditional clearing of the errorcode, so I'll bet #2 applies.
Actually I didn't look too carefully at the list of changes it made. There were so many other changes due to code that I moved around that I didn't bother to look. Lesson learned there.
Yes, it did just insert a clear error for the one error code. So I guess LV did everything correctly. I just saw that weird VI inserted in my code and didn't know why it got put there.
George
-
I converted a VI from LV8.6 to LV2009. There is a ClearError VI inserted in the error wire (see attached). Why did it do that?
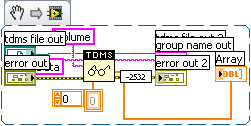
No my code isn't this ugly. I used the new create snippet to create the png file and it uglied it up a bit.
George

How long should I wait for my installer build?
in Application Builder, Installers and code distribution
Posted
Haven't met him yet. What does he do?
George