

george seifert
-
Posts
399 -
Joined
-
Last visited
-
Days Won
2
Content Type
Profiles
Forums
Downloads
Gallery
Posts posted by george seifert
-
-
Your comments got me to look closer at my simulated data. I knew my real data would be noisier, but it will also look more like a sine wave than the triangle wave I had. I bumped up the sample frequency and now it looks better. Sorry to say though that the contributed ideas won't work on the new data. I'm back to my original plan of finding peaks and differentiating. By finding the time between peaks in the differentiation I can get the gaps. OK anybody up for round 2?
George
-
 1
1
-
-
Does your data always have that oscillatory pattern?
This seems to work on your sim data, but I don't know how representative that is of your real data.

Thanks I like your way better. Actually I've done something like that in the past and completely forgot about it.
I don't know for sure yet what the real data will look like. I'm sure it won't be this nice. But this is a good place to start.
George
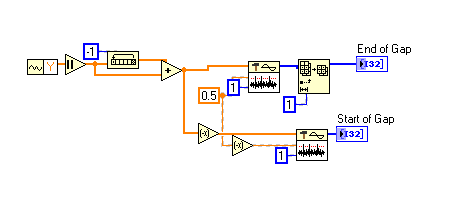
For this signal, you can just look for zeros in your data which will be the start and end of gaps.
Well you can't get much simpler than that. I'll bet Gary's method is faster though. I know I didn't make that part of the criteria.
-
I have a pulse train that I'll receive via a DAQ card that looks like this
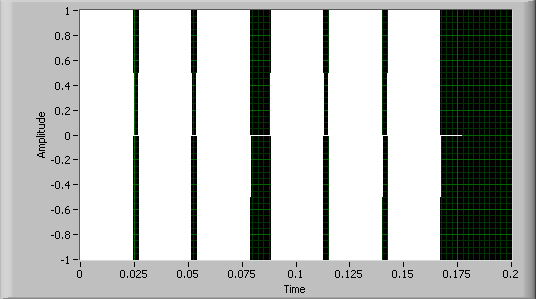
I need to find gaps in the pulses. I've attached a VI that generates simulated data and does the analysis. Basically I find the indicies of the peaks and then take the second derivative of those indicies. The gaps in the indicies give a spike in the second derivative. I can then use those spikes in the derivative to find the gaps.
I'm just wondering if there's a more elegant way to do this.
Thanks,
George
-
A true engineer would use duct tape!!!
Oh no, no, no. Masking tape is much nerdier.
-
1
-
-
That dancing baby gives me the creeps as well. But not as much as the Burger King.
Wow, I'm glad to know that I'm not the only one who is creeped out by the Burger King.
George
-
It depends... Is your cluster also a type def? -
Nope. It's just a plain old constant with no links to anything.
George
-
I discovered this when my executable wasn't working. I opened the VI and found that somehow some string constants in arrays in a cluster got wiped out (the arrays were emptied). This has happened a couple times now so I'm sure it wasn't a goofy slip on my part. There's no way I could have cleared 5 arrays without knowing it. Has anyone had something like this happen.
-
My PC at home is running 8.5 on Vista, SP2. Will I break LV if I move up to Windows 7?
Thanks in advance.

Uh, it Windows. What do you think?
Sorry, couldn't resist. I have nothing constructive to offer.
George
-
My memory's fuzzy on this, but doesn't -1,-1 do everything but the headers?
George
-
Thanks for the link (Ton's original post with that link didn't work) and the example.
Not to put a stop to all the other ideas, but I only needed to add tabs while in edit mode. Truth be told, it was a lot less work to just add them manually.
George
-
I thinks it's no good idea to have many tabs.
See, I knew somebody was going to chide me
 for having too many tabs. Really, in this case I need them.
Thanks for the ideas.
George
-
I need to build a tab control with many pages (I won't say how many because someone will surely scold me). I'm too lazy to go through and keep doing "Add page after". Is there another way to do this? I've searched through all the invoke and property nodes. There was an entry at NI for doing this with Labwindows, but that doesn't help.
George
-
QUOTE (Antoine Châlons @ Jun 9 2009, 09:53 AM)
Hello,As you can see http://www.sonicspot.com/guide/wavefiles.html' rel='nofollow' target="_blank">here there can be different variation on the WAV format, you need to find the description of the format in which your files were written to.
Then make a VI that reads the file byte per byte and decode "headers" by groups of byte.
NOTE : that would be nice to post it the LAVA cr :-o
Thanks. That's a start. Unfortunately I haven't been able to find anything on the net that describes where the Genre metadata is supposed to be in the file.
George
-
Has anyone used LV to access the meta data in a WAV file? I've searched the archives here and at NI and came up emtpy. Specifically I need to edit the Genre data. Another group here has written some software (not in LV - shame on them) to process WAV files. They use the Genre data for some reason to pass data into their program.
George
-
What's the best way to compute a linear fit on data that contains NaN values? In our data acquisition we occasionally get some invalid data that gets passed along (by my VIs) as NaN. This data then gets fed to the Linear Fit Coefficients VI which gives NaN results if any of the inputs are NaN.
George
-
QUOTE (candidus @ May 28 2009, 10:45 AM)
Without looking on your code (I don't have LV8.2),you could try to feed your graph with an initial value
(empty data with the correct type) so the graph
set its data representation to the type of the initial value.
Hey that worked! I feed a double into the graph outside the typedef and then I replaced the graph in the typedef with the new one.
Thanks much.
George
-
I've run across a problem with a graph within a typedef that doesn't display NaN values properly. Nornally NaNs are ignored and no points are plotted, but in my case the values show up as huge numbers. In the enclosed example I feed values to the graph within the typedef and the same graph disconnected from the typedef. You can see that the non typedef graph is fine. I think the problem has to do with the representation of the numbers in the graph because even with the non typedef graph if I make the representation of the number I32 instead of double it will display as the typedef graph. I can't figure out how to make the representation of the numbers in the graph within the typedef be doubles. Even if I change the formatting of the axes to be floating point it still doesn't help. Any thoughts on what I can do?
 Bundled
 -
Wow, lots of good ideas. Thanks. I was really thinking there weren't many options.
I think the only thing that won't work is to change the privileges. All users logon to this PC with a generic lab logon so there's no way to give rights to certain people. Unless maybe there's a way to protect the file from changes being made in Notepad or Word versus being written from LV.
George
-
Is there any way to protect a text file written using the Configuration File VIs? I didn't think I'd run into a problem using an unprotected/unencrypted file in the area I'm in, but I did. I have a bunch of routines in place for reading/writing these files so I'd rather not have to switch to a different type of file. The only thing I've come up with so far is to write the file like I usually do and then convert that file to some type of binary or XML format and then delete the text file. Then I'd reverse the process to do a read. Is there a more elegant way to do it?
George
-
NI has confirmed this bug. They had to let it run over the weekend so it's not surprising that no one else here saw the problem. I don't know what it is about my system that I see the problem so quickly. Just lucky I guess.
George
-
Thanks guys for trying it out. I don't know what's different about my system. I have two different apps built into executables that have shown this problem on several different PCs so I know it's real. I've reported it to NI so we'll see if they can reproduce it.
George
-
I've run into this bug a few times now so I think it's real. I'd appreciate it someone could run the simple attached VI (LV 8.6.1) and let me know if you get the same error. I was getting this with LV 8.6.0 also.
The problem is that the Actual Start value (Current Iteration Timing from the Left Data Node in a timed loop) occasionally reports a huge value (18446744069414584318 or something like that). It seems worse when there are two timed loops running. There doesn't seem to be any consistency in when it happens so you may have to let the VI run awhile before it happens. In my tests though it always happened within a couple of minutes.
Thanks,
George
-
QUOTE (CooLDuDe @ Apr 8 2009, 09:12 AM)
hi frnds,I want to Control DC Motor using NI DAQ Card 6221. My problem is that when i connect the motor to daq card, its not rotating, I have check the voltage at the terminals of DAQ card, its giving me the required voltage, But the motor is not Driving. I have also check the specification of DAQ 6221. there its written the Output Current Drive =+- 5mA.
So maybe that why i cant drive the motor, So now what can i do?

Can anyone plz suggest me??
Thanks in Advance
The first step is find out how much current drive your motor needs. If you have a power supply with a meter on it that will help with this step (hopefully your supply will have enough drive). If the supply doesn't have a built in meter then connect a DVM (set to measure current) in series with the motor. Now armed with that knowledge you can figure out where to go next.
-
QUOTE (Kubo @ Mar 31 2009, 03:20 PM)
Hello everyone,I can't seem to figure out this little problem.
With my program I have made an installer to transfer it to another computer. I put it on one computer (has an older labview on it), and everything seems to work great. Then I put it on another computer without labview on it and it seems that it wont let me select a com port in my control to a serial connection. The rest of the program works fine... it just wont display the serial output which it needs to make the program function correctly. Is this because the measurement & automation program needs to be installed? Or maybe something else?
Have you installed VISA?
George

Finding gaps in pulse train
in LabVIEW General
Posted
Ideally I need to find the start and stop of all the gaps. I need separate out and save the chunk of data between the gaps.
George
Using loops isn't necessarily a killer, but I do need to keep processing time to a minimum.
I think a SMA could work, but I think it'll be a little sloppy on finding the edges of the gaps (depending on how many samples I average).
Thanks for keeping the ideas coming. They may not work as is, but usually I get enough of a nudge in the right direction to figure it out.
George