

Gary Rubin
-
Posts
633 -
Joined
-
Last visited
-
Days Won
4
Content Type
Profiles
Forums
Downloads
Gallery
Posts posted by Gary Rubin
-
-
Your solution requires at least three times as much allocated memory. It might also be slower (which one might or might not care about). I've learned to optimize for memory allocation in LabVIEW to get maximum performance out of my applications.
Hmmm... Any chance you could post your VI saved as 7.1?
Thanks,
Gary
-
Forgive me if I'm being dense here, but how is that different from doing this?

-
if you have opened the right palette, click on the 'up' arrow and hold the mouse down. This will show a drop down menu with the path of the palette:
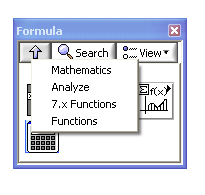
Ton
Perfect! Thanks!
-
Lynne,
I didn't fill out the survey (sorry
 ), but I do have a comment on Labview Help.
 I recently tried to use the "Find on the Functions palette" button to locate the Matlab script node. This popped up the Formula palette where the script node is located, it didn't actually help me figure out how to find it. The Matlab script node is several layers deep in the classic function palette: Analyze -> Mathematics -> Formula -> Matlab Script. It would be nice if the help entry or the "Find on the Functions palette" utility would tell/show me how to get to a native function. Sort of an issue of "giving a fish" vs. "teaching how to fish"...
Thanks,
Gary
-
Yep - it was something trivial - you need to run the VI to have the buffer allocations show

I don't have 8.20 in front of me at the moment, but if I remember correctly, I think that maybe saving the VI will cause the buffer allocations to show up.
-
Thank you Dan, but I don't think your program works the way I want it. The max and min results did not look right because they were greater than 1. The RNG should give numbers between 0-1.
Expand the indicator so you can see the whole number. You'll see that there's a E-x hidden there.
Edit:
Also I've written my program in such a way that using Enabling Index is the most simplest way and I like to make it work that way.The advantage of doing it with the shift registers the way that Dan did is that it allows you to monitor (via plotting, probing, or statistics) your arrays as they are built. This helps quite a bit in debugging. It will, however, result in a performance hit if your arrays grow to be very large.
Gary
-
You can use a second y-axis.
Right click on the y-axis. Select Duplicate Scale. Right click on the new axis and select Swap Sides (if you like).
Right click the plots in the plot legend and choose the y-axis that you want that plot to be associated with.
-
During a computation algorithm subject in my undergrad physics degree, I remember one assignment was to (in any language) create a program to do an FFT. Well (you can probably see this one coming), I just plopped a vi.lib FFT down on a block diagram, created some controls/indicators and wrapped an error case around it and submitted it to see what would happen. Turns out the lecturer gave me 100% (thanks NI!) but I got an email strongly suggesting I not try that again (hey! I was participating in reuse!)
I did my master's-level Computational Physics II homework in Labview. Most of the other students were using Matlab, so they had access to just as many pre-built primitives as I did (if not more). My code wasn't the most elegant - with only a week to work on each assignment, but at least I didn't have to set aside a whole day for debugging parenthesis and semicolons.
It was a lot fun to use Labview for solving totally different types of problems than I usually encounter at work.
-
hi dears
I'm new to labview
how can i integrate this matlab code to labview
I want to create a flute tone using labview ...Please any idea's about sound and music will be great.
with best regards to u all .
Go to Find Examples in the Labview Help menu.
Search for Matlab. Open MATLAB Script - Fractal example.
If you have Matlab installed on the system, and are using the Matlab script node within Labview, it will launch an instance of Matlab and execute whatever you put into the script node.
Gary
-
The casual user might be detered by changing the extension from an easily open file type. You mention that one is an XML file, but you could always rename it something like .mysettings or even hide them using the operating system's hiding capabilities ( assuming that the user hasn't turned that option off! )
In addition to using a different extension, you could also try starting the filename with a ~, the way MS-Office names files that are in use. It obviously won't prevent anyone from being able to modify things, but maybe they've already been trained by MS to keep their hands off things that look like system files.
edit: Or make the files read-only, and change that programmatically when you have to modify them within your code? I've never tried this, but I assume it could be done.
Gary
-
Might I humbly put in a plug for reconsidering option 1? In my estimation, the picture control is one of the most powerful, yet under utilized features available in LabVIEW. Yes, it will take a little work to get going, but a few *well thought out* VIs for implementing your current requirements using the PC could be very handy later down the road.
I'll have to give it a try sometime. This project is actually going to be moving away from using its own display - instead passing data to an existing display. Because of that, I not sure it's worth spending the time to do a major rewrite of the plotting method. It does, however, sound like something I should play with in my free time.
I can see where the flexibility of drawing your own pictures could be very powerful, but what about performance? How does running though all the picture control routines compare to just wiring into an indicator?
Are there any resources that you can recommend that will give me an idea of smart vs. dumb ways to do things? For example, is it best to always erase first (I would guess not)? Does it make sense to try to keep track of "foreground" vs. "background" pixels to avoid redrawing the background when not necessary? That then gets a little complicated because removing a point would require replacing its pixels with whatever was there before (i.e. the background).
Thanks,
Gary
-
Hi all,
For one of our applications, we want to plot points on a polar plot, using lots of different colors for the symbols.
I figured there were two solutions for this:
1) "manually" draw the plot symbols in the polar plot picture indicator (ugh)
2) create the polar plot picture control, and put a transparent x-y plot on top of it.
I elected to go with option 2, knowing that my performance was probably going to suffer a bit because I've got a transparent front panel object overlapping another object.
I was therefore pretty excited when our local NI rep told me about the new "background picture" feature of LV 8.x X-Y plots. I was hopeful that a single integrated indicator that contains the foreground X-Y plot AND the background would be more efficient at redrawing itself than my transparent overlay approach. Instead, I've found the following (see attached):
- If the background picture is not updated, the transparent X-Y sitting atop a picture indicator runs just as fast as the new X-Y with background picture.
- If the background picture IS updated, the new integrated background picture is actually a factor of 8-10 SLOWER than the transparent overlay (I suspect this is because of the property node)

So, what gives? What benefits do I actually get from the new background picture feature?
Thanks,
Gary
-
Take a look at the programming popularity index LabVIEW is far down as number 33. FORTRAN is number 21 and is twice as popular

It's even behind Logo
 . The last time I saw that language was on an Apple II in my 7th grade computer class.
I'd like to see someone do data processing using a turtle holding a pen in its tail.
-
I like that idea! :thumbup:
-
One other little note: when you have a queue of 1D arrays of <whatever>, each enqueue operation can pass in a different size array, i.e., an array of 49 elements, followed by an array of 3117 elements, an array of 3 elements, etc. Of course, this may not necessarily be the friendliest thing to do to your downstream data consumer...
That's the way my LV2 works right now. It doesn't make for smooth dataflow, but it makes sure that the consumer is not waiting for more when it could be processing what's available.
-
There is a nice function called "Flush Queue" This will return all of the available elements from the Queue, and empty it.
...
Hope I answered your question(s)
That's exactly what I was looking for! Thanks!
-
While we're on the topic of queues, I have some pretty basic questions about them. I use LV2 Globals for passing data asynchronously between acquisition and processing routines, but have become curious about the applicability of queues, especially after reading about their efficiency.
I just played with the LV7.1 queue examples and read the online help about queues, but I still feel like I'm not understanding their true power.
My typical LV2 Global looks like this:
2 Shift Registers: one containing an array and the other containing a Count I32 scalar
Init Case: Initialize array and put into shift register
Put Case: Take in new data, put into shift register array using Replace Array Subset and increment Count
Get Case: Use Array Subset, get data up to Count, and reset count to zero.
Typically, my put case (acquisition) will run in a much faster loop than my get case (processing/display/storage), meaning that I will be "getting" arrays of data, after having "put" many scalars.
I was thinking about whether replacing this approach with queues would be beneficial, and here's what I'm still not sure about:
From what I can tell, you can only dequeue the same datatype that you enqueue. I would have assumed that if I enqueue a scalar in the form of an array of length = 1, then dequeue the array, it would have given me the whole contents of the queue, but this wasn't the case. I also don't see any sort of way of saying "dequeue the last N queued elements".
Therefore, ff I wanted to use queues for this type of data transfer, I would have to put the Dequeue, along with Get Queue status, in a while loop and run it until the queue is empty. Is that correct? If so, can that really be more efficient than what I'm doing now?
Thanks,
Gary
-
Well, just follow the link
and you should see that Ben is probably right.
Shoulda clicked the link...
-
(reminds me of a great Mel Brooks movie
Care to elaborate?

-
Has anyone read "Labview Digital Signal Processing" by Cory Clark?
How was it? Did you find it useful? Does it cover digital receiver algorithms?
Thanks,
Gary
-
How can I remove "All files" pattern in File Dialog
If you're asking about 8.2, I can't help you. If you're asking about 7, just wire your desired pattern (i.e. *.txt) as a text string into the Pattern input terminal on the file dialog primative (lower left corner).
Gary
-
I used this with version 7.1 and it locked up as you said, then I used it in 8.20 and it worked just fine. Maybe it is a bug in 7.1.
Thanks,
Gary
-
You can draw text in a picture as stacked, clockwise, or counter-clockwise. So if you could use picture controls instead...
That would work in general for a text string, but I think replacing the text string in the Cursor Legend with a picture containing text is well beyond me.
-
WARNING!!! TESTING THIS MAY CAUSE LABVIEW TO LOCK UP!!!
I am playing with ways to clean up a front panel, and want to give the user the ability to hide/unhide graph palettes without assuming that they know about the right click > Visible Items technique.
I've run into a problem when trying to use the ScaleLegendVis property node for an intensity graph. When I try to run the attached VI, and set Graph Palette Visible to true, it works as expected with no problem.
However, when I try to make the Scale Legend visible programatically, LV freezes up.
I noticed if I right click and select Visible Items while the VI is running, Scale Legend is disabled. The help for the property node says that Scale Legend Visible is settable while the VI is running.
Is the documentation for that property wrong? Is it not really settable while running?
Thanks,
Gary

[CR] Random permutation
in Code Repository (Uncertified)
Posted
Thanks,
Gary