

torekp
-
Posts
216 -
Joined
-
Last visited
-
Days Won
3
Content Type
Profiles
Forums
Downloads
Gallery
Posts posted by torekp
-
-
QUOTE (Anders Björk @ Jan 20 2009, 05:40 PM)
I have an activex variant that gives this type of data (which I have get by a calling IProjectData):A pointer to IProjectData in which the data matrix contains:
First dimension of the variant = number of observations in the model
Second dimension of the variant = number of components in the model+1 (the 0 component).
[...]
A fix seems to be do not wire the type in Variant to data...
I don't get it. If you still need a better fix, could you post a custom control, or something, which shows the data structure you're talking about? Maybe show us a variant where you've "made current value default", too?
-
Thanks Toby, I'll try that.
-
So here's the deal. My mother-in-law is 70-something, and we got her an internet connection through AT&T. AT&T's website was designed by user-hostile people who like making you click 7 different buttons before you can actually read email. Each button is conveniently tiny and located in random locations within a very busy screen:

So, Labview can handle this, right? My first thought was ActiveX. I copied some ideas from another LAVA thread, and made it as far as an email-reading page that has lots of "scripts" rather than "forms". Did I mention that I don't understand the IE object model?
Here are my VIs so far, along with the source code for the pages I'm trying to navigate through. I would like to have Labview set it up so that as soon as her computer turns on, IE launches within Labview and goes to the email website and opens the most recent email. So far I've managed to log myself in (which I will change to her account once I've got everything working) and go to AT&T's first email page (i.e. the first of many you must visit before actually reading anything). That's it. I'm stuck.
It might be simpler to sign myself and her up for some free email (gmail?), so if you have ideas along that line, do tell. :worship: in advance to anyone who can solve this!
-
Found an error in the termination condition for the creation of the PLS model (should stop if i+1 >= N, not if i >= N). Here's the fix.
-
In case anyone is interested, I translated from Matlab a program to do Partial Least Squares. Here it is. It gives the same result on a test as the original Matlab program, but if that original program were flawed I'd never know it. A little knowledge, dangerous thing, yada yada.
Note: the file-reading part assumes that each class is grouped. All the class 1's come before all the class 0's, or vice versa; and so on for other classes.
-
QUOTE (Anders Björk @ Dec 16 2008, 07:28 PM)
Great! I would like to test it, if you get it working.Here you go. Based on the Matlab program by Evgeny Krestyannikov that you pointed out to me. The top-level example program is in the folder called tests. Read the documentation for that VI and for its main subVI, and the websites mentioned therein, for hints at how it's supposed to work. Especially, note that data must be sorted by group#.
It's not polished at all. It does seem to work, but I'm a bit over my head here. If a little knowledge is a dangerous thing, then I belong on the FBI's ten most wanted list. I think I'll turn to Partial Least Squares instead, as you suggested.
-
Awesome, Anders, thank you very much! I think I can translate from Matlab :thumbup:
-
Does anyone know how to do Multiple Discrimant Analysis (here is a website explaining it a bit) in Labview? It is supposed to be similar to Principal Components Analysis, which I am already doing. I attach my PCA programs (8.5, Full). That much was easy.
Maybe someone who speaks "math" better than I do could tell me whether the website I mentioned contains all the recipe I need? Labview Full has a built-in covariance function, for what that's worth.
-
Is this good enough?
All I did was add a dimension to your initialization of the array, and configure the "build array" function to concatenate the arrays rather than increase the dimension.
-
QUOTE (GregSands @ Oct 27 2008, 11:24 PM)
Does the experimental clustering library at http://www.ni.com/labs/' target="_blank">NI Labs help you at all?Cheers ~ Greg
Wow! I haven't tried yet, but I imagine so.
It figures. Every time I reinvent the wheel, either NI publishes the same thing a little later, or I discover it in OpenG or something.
Usually a lot more robust & versatile than my version.
-
Thanks guys, y'all rock.
-
And here is my attempt to follow this recipe (thanks, Los Alamos!) using SVD. I changed from normalizing my data matrix to merely centering it, but I changed my earlier VI similarly and the results agree. Hooray! Does this mean I actually did this right?
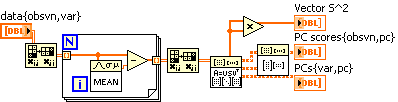
According to the website, Vector S^2 is proportional to the variances of the principal components, so I'm taking that as a measure of how important each Component is.
-
QUOTE (Anders Björk @ Oct 20 2008, 03:16 PM)
Can you explain that more fully?
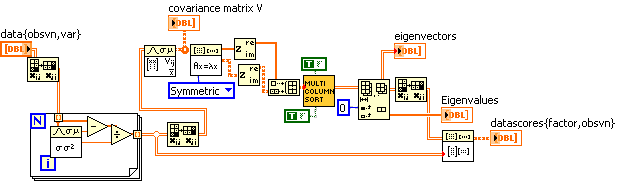
Here is my attempt to follow someone else's recipe for PCA (pp. 52-53). I made up some data, and the resulting factor weights (eigenvectors) and eigenvalues SEEM reasonable, but what do I know. (Not much.)

-
Thanks Anders,
That sounds like a really smart idea to save lots of computing time. Unfortunately it involves more programming time
 - I guess I'll see how bad this k-means computation is, first.
 -
I found one resource on clustering in Labview, using k-means:
http://forums.ni.com/ni/board/message?boar...uireLogin=False
and several non-Labview free software packages:
http://glaros.dtc.umn.edu/gkhome/cluto/cluto/overview
http://www.prudsys.com/Produkte/Algorithmen/Xelopes/
http://www.shih.be/dataMiner/screenShots.html
... and I'm just wondering if anyone has any suggestions. My data has over 1k dimensions and probably 10k samples (observed ordered N-tuples) and I want to cluster into some fixed number of groups, less than 10.
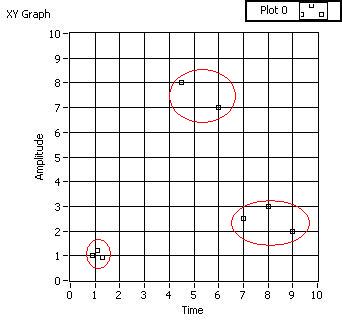
For a simple 2D example of clustering, here's some made-up data clustered into 3 groups:
-
Thanks, you guys are pure awesomeness as usual.
-
Sometimes I like to push my luck and read in a really big file full of data. Resulting in "Not enough memory to complete this operation" and "LabVIEW: Memory is full. Blahblah.vi was stopped ... yada yada". If I look at Windows Task Manager on the Performance tab, memory is taxed but not really overloaded; I guess Labview or Windows or somebody is being conservative about it. Not that there's anything wrong with that.
My program runs on different computers which may have different amounts of memory.
So, how do I tell in advance, how much memory I can suck up with LV before this would happen? Let's just stipulate that other processes aren't using much memory. Anyway, I can always consult that thread about CPU usage, to get ideas on how much page file bytes are being used; but that's not what I want to know right now. I know approximately where the top of my head is, it's the location of the ceiling that escapes me.
Oh, and if you haven't seen the Far Side cartoon referenced in the title - or seen it lately - here you go.
-
Thanks guys! That was quick - and sure enough, I was being a moron
 Doh!
Doh! -
Here is the block diagram of a little test-program I wrote. It's very messy, I'm sorry - it is only a test which will be discarded soon, so I didn't bother trying to make it look nice.
My problem is: sometimes both loops execute (intended behavior), but sometimes only the top one does.
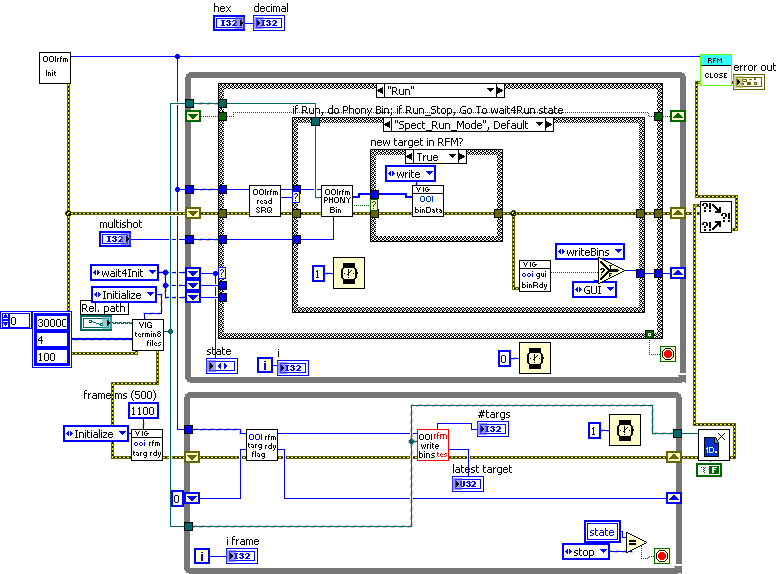
I'd attach the VIs too, but they require DLL's which I'm not licensed to spread around. The blue wire originating with OOIrfm Init represents an open link to a Reflective Memory card. The blue-green wire originating with VIG_termin8_files represents an open binary file. These are resources that are shared by the two loops. Is that causing my problem, do you think?
-
Thanks Anders. I wrote a preliminary Logistic Regression solver, but it performs very poorly when the number of pieces of scrap metal is >300 or so. Here it is, in case anyone's interested. It requires the Optimization VIs, which you only get with Labview ... full? Professional? Not sure.
I also found this web-based Logistic Regression calculator, which really helped me test my stuff. I haven't tested large datasets in the web-based one yet, to see if it's faster. Edit: the web page algorithm is a lot faster.
Meanwhile, I haven't done anything on the PCA front yet. But I'll start by looking on LAVA as you suggested.
-
Thanks again. Would you like to comment on the "philosophical" aspects of PCA vs Logistic modeling vs whatever? I'm not very familiar with PCA. From what I've read, it seems like it's designed more to select which measures to use, rather than (or in addition to) telling you how much weight to put on each measure.
In my case, I already have a good idea which measures I want to use. All of them contribute to improving the signal to noise ratio. You're right by the way, there are less than 10.
-
I do this kind of thing fairly often, so here are the VIs I've created for the purpose. I'm sitting at a Labview-less computer right now, so I can't check to see if these call any of my other VIs, but I don't think they do. Labview 8.5.1
-
QUOTE (Anders Björk @ Jul 2 2008, 03:15 PM)
Why not use principal component analysis to cluster different scrap classess togheter instead, from my perspektive that would be eaiser (probally more robust). Ones you found the classes you could build a classifier based the on PCA scores.Another method to use would be discrimant analysis using partial least squares.
Thanks for the ideas. Without buying the Toolkit from NI (advanced signal processing, I think it was), how would you set up PCA analysis in Labview?
-
How would you do logistic regression in Labview? Some key points (see the wiki link for more detail), where f(z) is a probability function for some event:

The variable z is usually defined as
 where β0 is called the "intercept" and β1, β2, β3, and so on, are called the "regression coefficients" of x1, x2, x3 respectively. To find the parameters βi, one optimizes them such as to obtain the maximum likelihood of getting the actual observed data. Making a few semi-reasonable assumptions, this amounts to maximizing
where L(theta) = the likelihood of getting the observed data, and L* is just the log of that.
Why use this approach? In my application, I've got a few categories of scrap metal that I'm trying to sort, let's say Al, Mg, and Zn. They're on a belt, and several diagnostic tests are done as they whiz by; each test outputs one or more real numbers. No one test is absolutely decisive, thus the need for optimizing their weightings.
I'm thinking of negating L*(theta) and using Conjugate Gradient nD.vi from the optimization palette. Does anyone have experience with this type of problem, and want to offer advice? If you thinking I'm barking up the wrong statistical/optimization tree, I'd like to hear your thoughts on that too.


False DAQmx channels
in Hardware
Posted
Maybe I misunderstood your question, but you can use NI-MAX to create simulated DAQ devices, complete with all the usual channels. I've done that and gotten some good mileage out of it.
I'm not at my NI-MAX computer right now, so the following is from memory.
Just right-click in the place in the tree where your devices are listed, and choose Add DAQ device. You can choose a virtual/simulated device.