Search the Community
Showing results for tags 'ui plugin'.
Found 3 results
-
 This toolkit offer you an efficient, stable, and reliable front panel control value refresh function. User can design their UI dashboard without any code development. 1. Powerful parallel execution capability, Support clone reentrant execution running mode, you can create multi dashboard UIs at the same time and controls can synchronous refresh across different UI. 2. High-speed data refresh capability, even with thousands of controls on a single UI, can easily maintain a refresh rate of 50ms while consuming very little CPU resources. 3. Support all control data types that "Tag Engine" support, this mean the only thing you need to do is to change the control "Label" with "Tag name", then the control will refresh automatically. 4. Support "muParser Expression", you can type the control "Label" with "Expression" that muParser Expression support, For example "a + b" "a > 1 & b >= 2".
- 9 replies
-
- 1
-

-
- ui tools;
- tag engine
- (and 3 more)
-
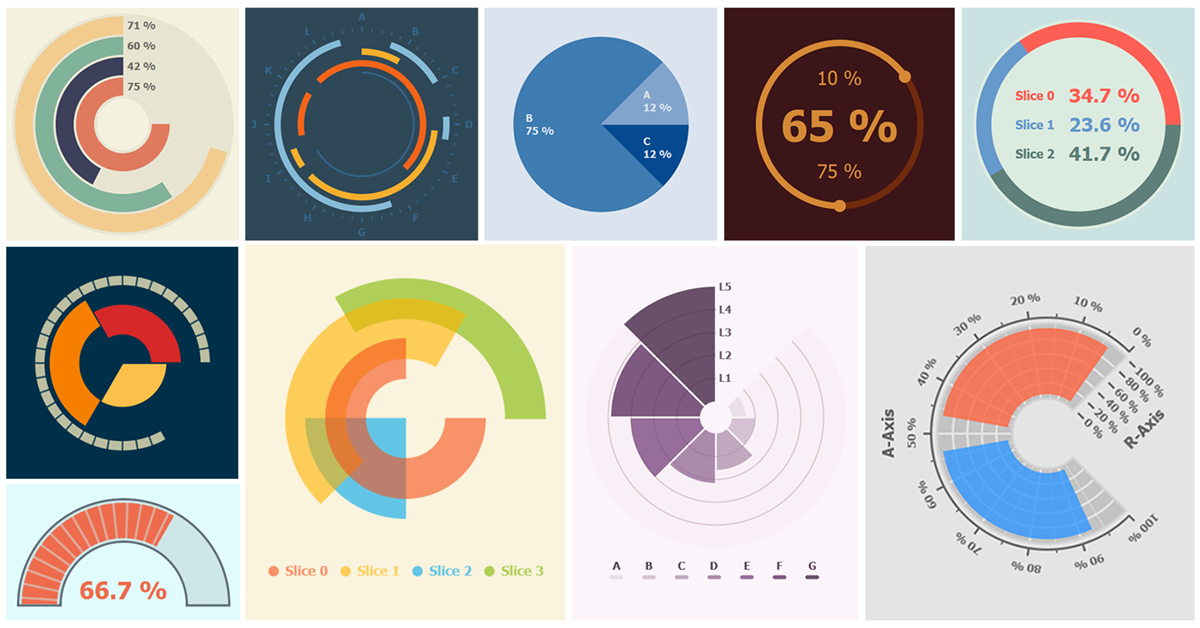
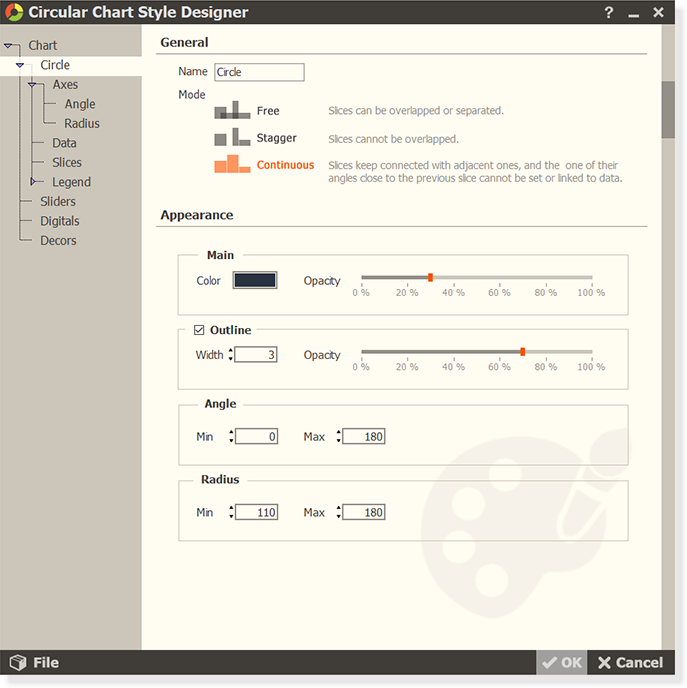
Circular Chart Base A flexible and easy way to create high quality circular charts with features such as anti-aliased and translucence, helps you to deal with the boring and time-consuming drawing details. http://sine.ni.com/nips/cds/view/p/lang/en/nid/217432 Features Chart Types : Supports multiple types of charts, e.g. , pie chart, doughnut chart, polar area chart, circular bar chart, circular slide, graduated gauge chart. Chart Elements : Multiple types of chart elements can be added to the chart, e.g. , legend, scale, grid, slider, digital, decoration. Slice Modes : Three modes for different overlapping and connecting relationships between slices. Customizable : Most properties of chart objects are customizable. Reusing & Sharing : Charts can export images for reporting, and their styles can also be saved as files for reusing and sharing. Quick-Start : Easy to use, and you can quick-start your development based on several build-in styles. How to Use Single Control : The Circular Chart Add-On is ultimately defined as a single control. Chart Styles : Being edited or loaded with different styles, the chart can be presented in the different types listed above, or even more. Style Designer : The chart style is configured by the Chart Style Designer dialog box, which can be displayed through the right-click menu of the chart, similar to the Properties dialog box of the LabVIEW controls. Auto Reload : After configured, the style can be saved into the chart instance in your VI and automatically reloaded the next time. Data Type : The data type of the chart is 2-D array of SGL numeric. Each row of the array corresponds to a slice in turn, and each column corresponds to a slice parameter you specify in the Chart Style Designer, the available slice parameters include start angle, end angle, inner radius, and outer radius. http://sine.ni.com/nips/cds/view/p/lang/en/nid/217432 http://kitx.mystrikingly.com/
-
 Hi, I am making a determined effort to migrate a particular application of mine over the fence to OO, but I would like to be "herded" towards using the correct or proper design pattern(s). This application of mine is a TCP Client app that allows the user to connect to one (1) test server as to display test data in various forms (i.e. tabular, time-histories, gauges, etc.) using a single tab control. There can be up to ten (10) such Clients logged in at one time to the same Server. I have read recently that several folks on NI & LAVA forums advise to move away from the tab control and to use sub panels instead. Combine that with this web page's neat UI plugin example, I seem to be getting close to finding the proverbial "light switch" in the dark room, but ... it could be something else .... Some notes: I do have LabVIEW 2012 at my disposal. The test server is written in C++. Down the road a bit we may need to encrypt the XML stream so I may need to put a LabVIEW web service in between the Server and each Client using SSL - if that's a future design bit to note here but not as important as the basic environment or use case of a TCP Client that displays data via several types of displays - which the display types will only grow in the near future as we all have experienced. So adding different displays should be as "easy" as possible. Note: My question was originally posted here, but I was advised to post it here on LAVA for a more experienced architect to respond. Thank you very much in advance !!! CS