Leaderboard

Popular Content
Showing content with the highest reputation on 11/07/2017 in all areas
-
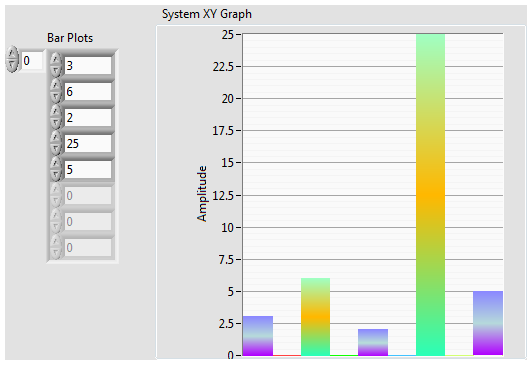
Okay how about this. Attached is an example where you give an array of Bar Plot values, and a gradient graph is generated. It uses the gradient code I posted earlier, along with code to get the colors of the plot, and find their positions for replacing. It is somewhat robust in that the plot size and positions can change and the new gradient overlays should be placed in the correct locations. At the moment only positive values are supported. If you really wanted I think you could give the 3D look with some minimal effort. This is all using the picture control overlay feature of the graph, and on initial creation you can see the flicker between the normal solid bars, and then the overlays. Gradient Bar Plot.zip
 1 point
 -
I was going to suggest the 2D picture control anyway. I mean you probably can do some post processing like get the image of the graph, and then overlay an image of the gradient on top, but I don't think it is all that hard to draw a gradient bar. Attached is some code that does the trick and pulls code from the dark side. Gradient Picture Hooovahh.zip1 point