Leaderboard


Popular Content
Showing content with the highest reputation on 06/26/2019 in all areas
-
Thanks. Issue 34 created.1 point
-
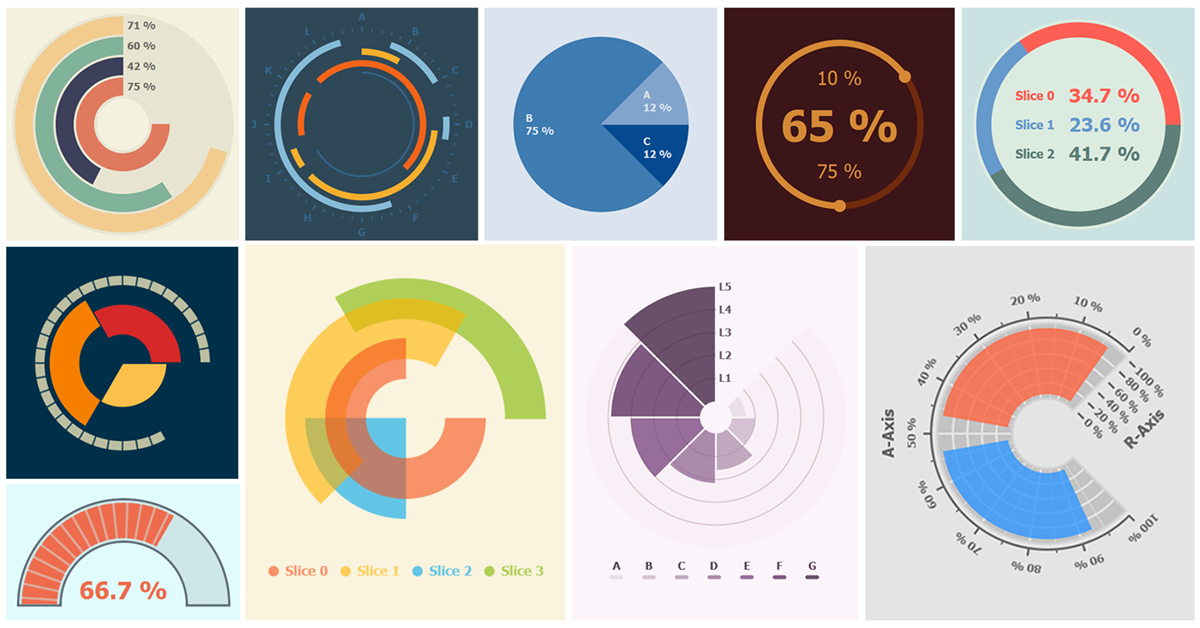
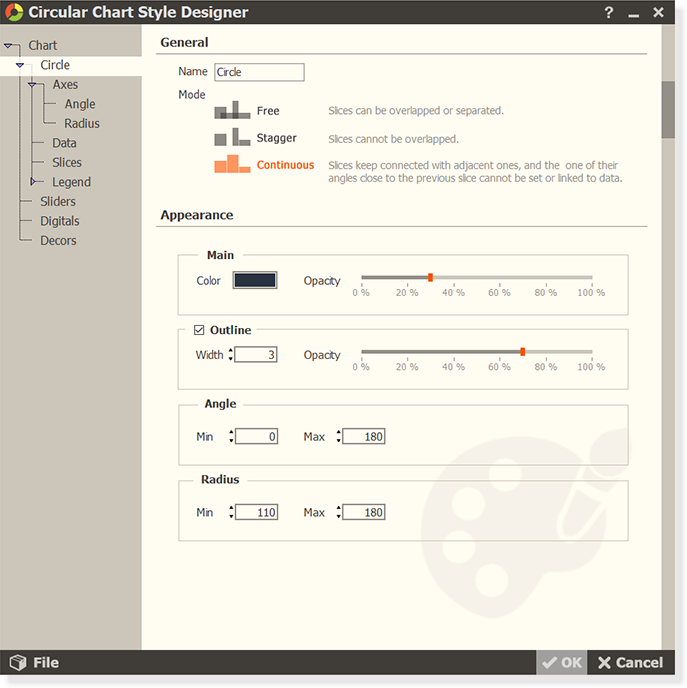
Circular Chart Base A flexible and easy way to create high quality circular charts with features such as anti-aliased and translucence, helps you to deal with the boring and time-consuming drawing details. http://sine.ni.com/nips/cds/view/p/lang/en/nid/217432 Features Chart Types : Supports multiple types of charts, e.g. , pie chart, doughnut chart, polar area chart, circular bar chart, circular slide, graduated gauge chart. Chart Elements : Multiple types of chart elements can be added to the chart, e.g. , legend, scale, grid, slider, digital, decoration. Slice Modes : Three modes for different overlapping and connecting relationships between slices. Customizable : Most properties of chart objects are customizable. Reusing & Sharing : Charts can export images for reporting, and their styles can also be saved as files for reusing and sharing. Quick-Start : Easy to use, and you can quick-start your development based on several build-in styles. How to Use Single Control : The Circular Chart Add-On is ultimately defined as a single control. Chart Styles : Being edited or loaded with different styles, the chart can be presented in the different types listed above, or even more. Style Designer : The chart style is configured by the Chart Style Designer dialog box, which can be displayed through the right-click menu of the chart, similar to the Properties dialog box of the LabVIEW controls. Auto Reload : After configured, the style can be saved into the chart instance in your VI and automatically reloaded the next time. Data Type : The data type of the chart is 2-D array of SGL numeric. Each row of the array corresponds to a slice in turn, and each column corresponds to a slice parameter you specify in the Chart Style Designer, the available slice parameters include start angle, end angle, inner radius, and outer radius. http://sine.ni.com/nips/cds/view/p/lang/en/nid/217432 http://kitx.mystrikingly.com/
 1 point