Leaderboard

Popular Content
Showing content with the highest reputation on 08/13/2021 in all areas
-
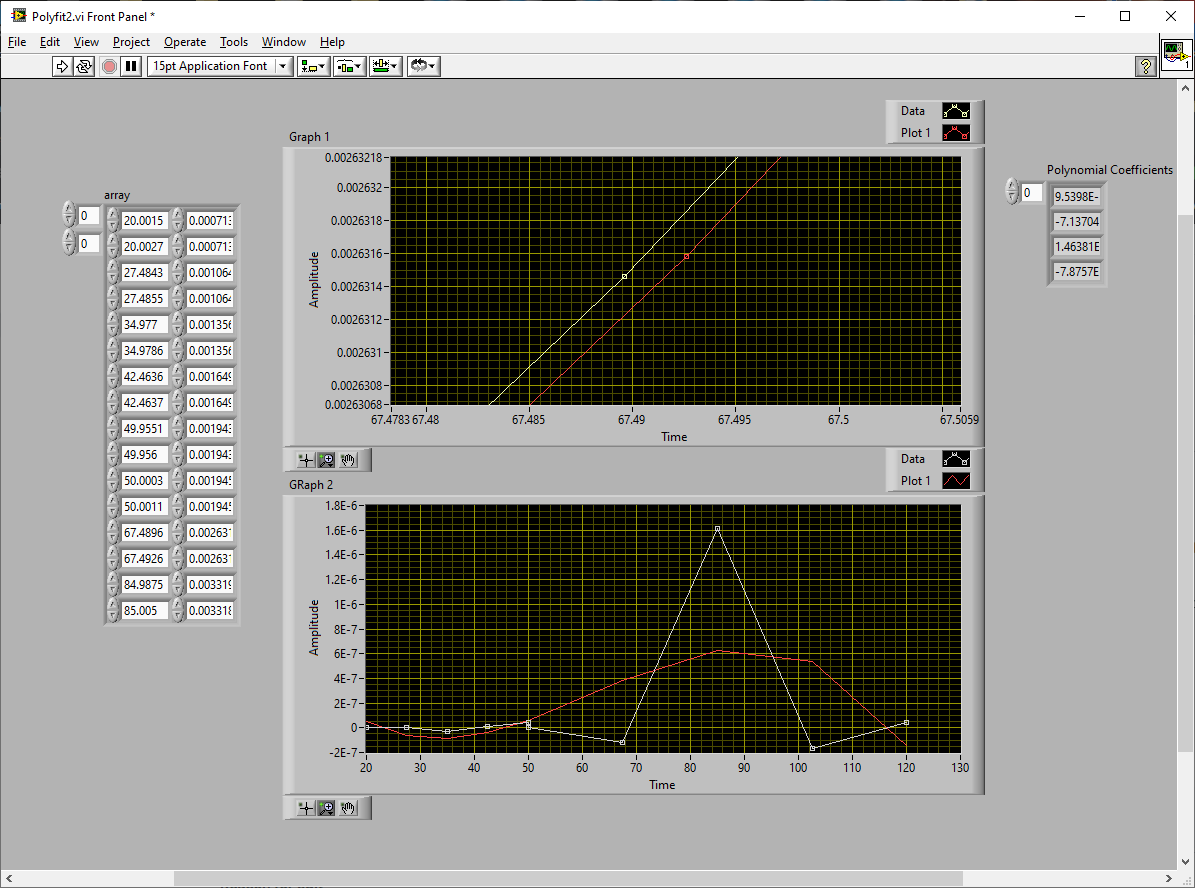
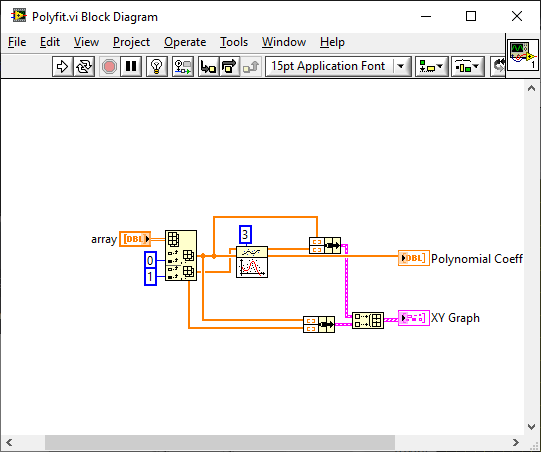
Looking more closely at your data snippet. Since the left column has 2 data points very close together (certainly within measurement noise) you could have 2 lines/curves which maybe max/min. You might get that sort of file, for example, if you want to test the linearity of analogue output device with a 110v supply and a 240v supply. You may set an output, measure at 110V then change the supply to 240v and take another measurement before moving on to the next analogue output level. Anyway. the analysis method is the same, you just need to de-interleave to get the two lines/curves and maybe subtract one from the other before doing the poly fit. Later.... Ah yes. Makes more sense now when you said "pairs of rows" and why you want a poly. Polyfit2.vi For some reason the decimate arrays crashes LV so I had to use a while loop.
 1 point
 -
Here ya go. Polyfit.vi Not sure why you would want a polyfit on a straight line though.
1 point