

PJM_labview
-
Posts
784 -
Joined
-
Last visited
-
Days Won
10
Content Type
Profiles
Forums
Downloads
Gallery
Posts posted by PJM_labview
-
-
I guess somebody found a new way of throwing money out of the window...
PJM
-
btw, Brian, using a template does indeed seem to be significantly faster.
Good idea.
PJM
-
Perhaps you should still check if the problem occurring in the VI sent to me by NI and attached at my above post really matches the problem that you have been facing. I only saw a small decline in speed, about 10-20% which is far from the slow down reduction numbers you got.
I did check before I post. I notice a significant slowdown (not in the 100 magnitude, but in the 10 magnitude). Here are screenshot of the before and after runned in LV 8.01.

Before

After
The after is about 10 time slower.
I dont know for sure that this is the same issue, but it look very similar.
Also, recently I seem to have experience the slowdown (in LV 8.01) with VI that do not appear to operate on references (I have not yet characterize this for sure Edit: such as the OpenG "List Directory Recursive__ogtk.vi"). I have not figured out the trigger mechanism (the one you describe for the reference in for loop or while loop, do not trigger it).
PJM
-
Jimi,
This is great news! :thumbup: Now that there is a fool proof way of reproducing this, it should be fairly easy for NI to fix this.
PJM
-
I think this might be due to the fact that member of lvlib are marked (a feature I really dislike). When you are dynamicaly generating the properties VIs, they are probably not marked and therefore the lvlib does not know it belong to itself.
Just my guess.
PJM
-
Adam,
Thanks for your post. The information you provide are very interesting for some applications. I can already see a couple of system I am working on that could benefit from this thread balancing setting change. Unfortunately, in the case of applications where one does not have access to the end user computer or when the computer changes, asking the end user to go through all these loops so it can run a piece of software (just becasue it is written using LV) is not a realistic option. This need to be fixed.
Thanks
PJM
-
Hi,
I noticed that since LV7.1 the behaviour of the continuous-button had changed.
e.g. the first call is always TRUE when in LV 7.1 it was only TRUE the first loop.
I'm curious if you could repeat your tests while running your vi conyinuously
using a while/for-loop and not using the continuous-button...
Keep us updated...
TNT
I am pretty convinced that this issue is not linked to the run continuously button. I used the run countinously button to characterize and benchmark the problem, but in regular applications (not running continuously), the problem is still there.
So far I have isolated the problem on VI operating on LV object reference in a for loop or a while loop.
Hi PJMI have experienced a similar problem that occurs from time to time. After this has happend a few times I tried to figure out what was happening and by coincidense I noticed that after a minimize followed by maximize of the LabVIEW front panel the problem dissapeared!?? And for the record the problem is even there when the VI has stopped and I am working in the diagram. (Here you will notice a slow reaction to mouse clicks).
Looking in the task manager showed that the LV process was using all the CPU power. I have also opened the Process Explorer and tried to find out what LV was dooing but I could not find anything. It all looked normal (port access, disk access, memory usage, TCP comm ...).
I think these problems are related to the LabVIEW <-> Windows interface and as one of the guys on info-labview pointed out it seems to be related to which window has the focus in the Windows operating system and the associated priority assigned by Windows. What NI should look into is why this did not happend in LV 7.1.1. on the same operating system.
Regards
Henrik Molsen
I am not 100% positive, but I don't remember that minimizing and maximizing does improve the performance at all. Next time I am in that situation, I will try to see if this has any impact.
And for the record the problem is even there when the VI has stopped and I am working in the diagramI have also noticed this (since LV 8.x) but I think this is another issue (more like an editor issue). I dont like this, but I can leave with this since it does not affect my buid app. The other issue I mentioned affect build app as well as app running in the IDE. For example we had report from some user of VIPM that sometime it start/run very slow (I have also experience this as well). This, I definitively linked it to the same issue.
Judging by the name "get all front panel controls", I wrote VI's doing similar things and because that was implemented with property nodes, I set them to run in the UI thread, preventing thread switches. Because it was in 7.1.1 I did not have your slowdown problem, but running in the UI thread gave an enormous speedup already. Maybe the slowdown is caused by a bug in the thread switching. Maybe you can try running this VI in the UI thread (if not already).Joris
Typically, I hardly ever change thread of my VI, and when I do so, I don't put anything in the UI thread (since there are already so much stuff running in there). The top level caller of the first particular VI I used to characterize the pb (Get all FP Controls) is a UI running in the UI thread and since I left the default thread setting to same as caller, I *think* this VI was running in the UI thread. But, next time I experience the slow down, I will try changing the threading explicitly.
PJM could you post VI that has the problem here to the forum?Jimi,
Here you go, but please note, this issue happens in many VIs (like the second one in my initial post that I wrote on the spot to characterize the problem).
Download File:post-121-1166801608.vi
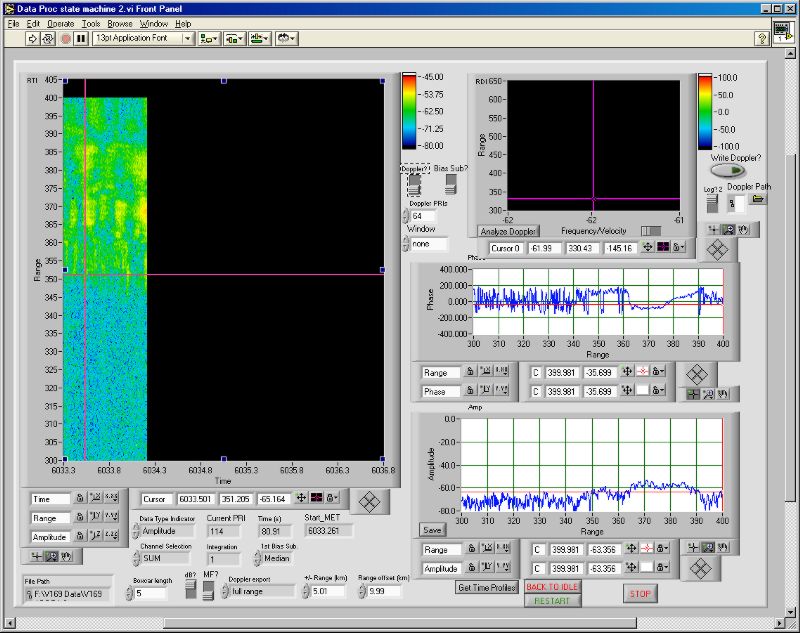
I'm not convinced that such behavior did not exist in LV7.1.1, although I do agree that it probably has something to do with the way Labview and Windows play together.I have a data processing tool that I have written (see screenshot). It essentially preallocates an array (on the order of 200 x 3000 elements) for the big intensity plot, then reads a chunk out of a file and does a bunch of number-crunching to obtain the next column of the intensity plot. There are also some property nodes related to cursors and making controls visible/invisible.
When I was running this on LV711 on Win2K, I found that if I clicked and held, but did not release, the Windows Minimize button, this program would run much faster. My system has since been upgraded(?) to WinXP (still running LV711), and I am unable to duplicate that behavior.
Edit: Adding screenshot.

I never experienced anything even remotely comparable to this slowdown in LV 7.1.1 (of course it does not mean that it is not there).
PJM
-
See this post on the LV 8.20 bug list.
PJM
-
I have been experiencing this bug since LabVIEW 8.0. I have not report it until now because it is VERY hard to reproduce. Nevertheless I have characterized it.
Note:
- I (and other coworkers) have encountered this bug on several machines running XP and LV 8.x or 8.20.
- This bug is present both in dev mode and in runtime mode.
Background:
In some instances, some LV code suddenly slow down so much that in most case it gave the impression that the LV prog has hanged.
Typically this seem to happen once or twice a week (I am using LabVIEW everyday) and only on some VIs.
Clicking, and shaking the hanged program title bar "unstuck" the prog temporary.
Restarting LV (or if in runtime environement, your program) fix the problem until the next time.
Characterization:
In one of these instance when the bug occurred, I spend several hours characterizing the issues.
I have first characterized this by comparing run time of a particular VI both in LV 7.1 and LV 8.0.
Note:
1) The slow down was happening on two VIs, one with a for loop another with a while loop. I just picked the one with the while loop to compute the stats.
2) The VI was run both on LV 7.1 and LV 8.01 for the same test set.
3) The VI was running continuously when the screenshot were taken.
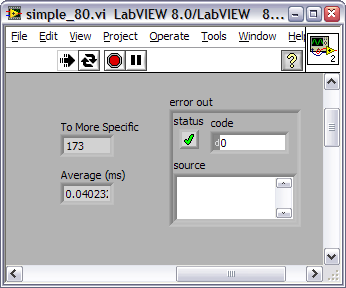
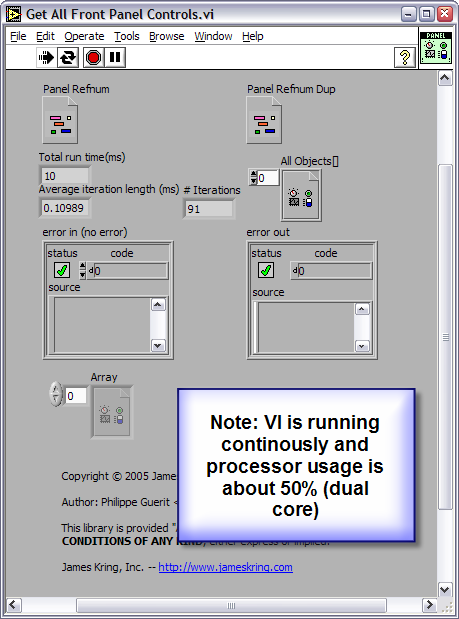
Below are screenshot and benchmark data of that particular VI.

This is on LabVIEW 7.1. Total run time (for 91 iterations) is about 10 ms with an average per iteration of about 0.11 ms (processor usage is 50%).
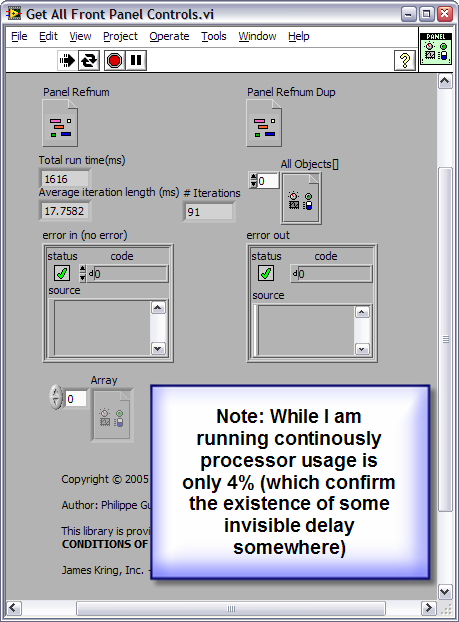
This is on LabVIEW 8.0.1. Total run time (for 91 iterations) is about 1616 ms with an average iteration of about 17.8 ms (actually the value are all over the place, from 12 ms to 25 ms). Processor usage in this case is very low (about 4%, in the noise level of idle)
Please Note: 1616/10=161. This VI is running 161 time slower on LV 8.0.1.
This first experiment let me to believe than this might be some optimization that went very bad and that it seem to happen only on VI manipulating LV Object References.
Further Investigation:
In another instance when my LV got in that slowdown state, I further narrowed the issue to the following:
This particular slowdown appears to happend only when operating on LV Object Reference in a For Loop or in a While Loop.
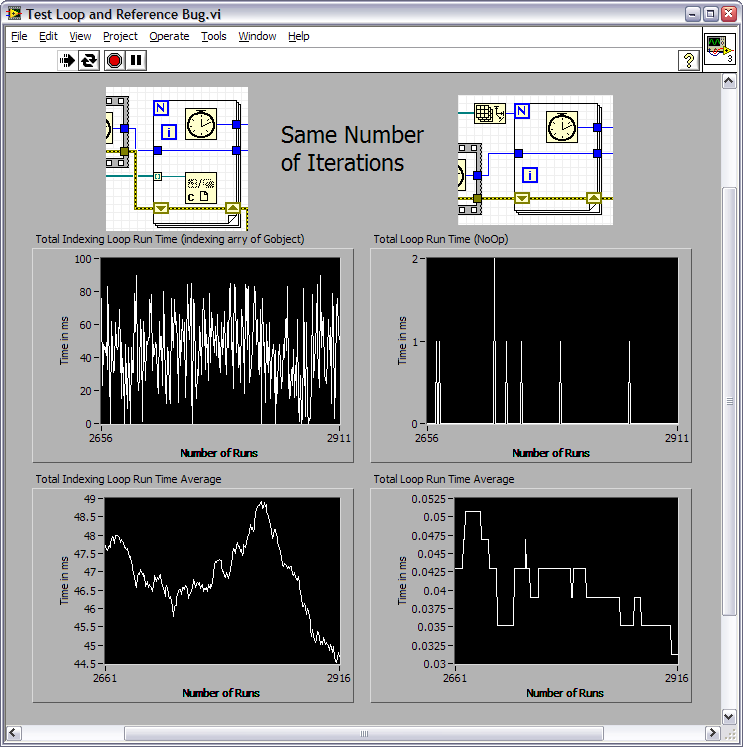
Below is a screenshot of the VI BD I used in both LV 7.1 and 8.0.1 to get to this conclusion.
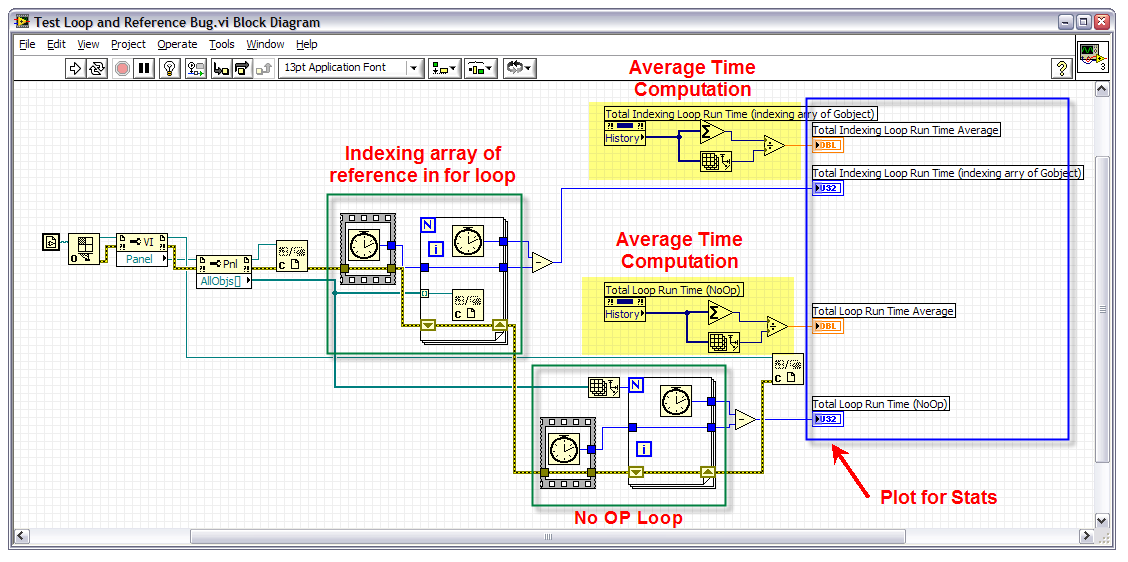
Once the statistical code is exclude, this VI is very simple. It just open a reference to itself, get all the Object Reference on its panel, then close the array of reference in a for loop (this last operation is benchmarked). Then for comparison sake, another identical for loop (doing pretty much nothing) is run for the same number of iterations and benchmarked.
This VI was run both on LV 7.1 and on LV 8.0.1 (when in the "slow down state").
Below are screenshots of the results. The Left side statistical data of the Panel is about the for loop that is indexing the array of Object reference. The right side statistical data of the panel is about the No Op for loop. On each side, the first plot is the delta t of the for loop run time and the second does average the delta t over each iteration of the continous run.
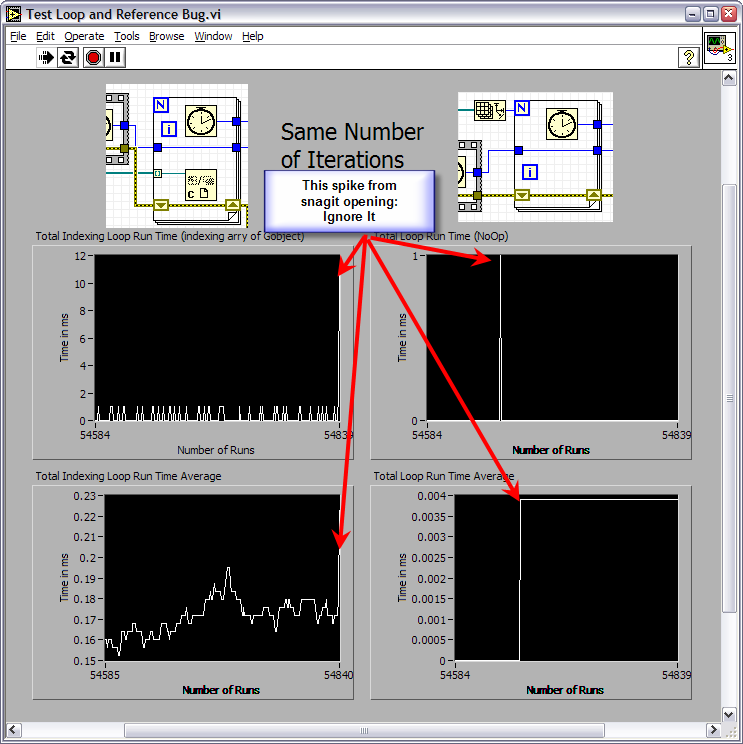
This is the VI running on LV 7.1: This is fast. Typically the indexing loop run in less that 0.2 ms

This is the VI running on LV 8.0.1: This is very slow. Typically the indexing loop run in more than 44 ms
Note: 44/0.2=220 This VI is running 240 time slower on LV 8.0.1.
Note: The No Op loop does also appear to be slower on LV 8.0.1 but the value are so low, I am not sure this is significant enough.
In any case, this is a very serious issue that I hope will be fixed.
PJM
- I (and other coworkers) have encountered this bug on several machines running XP and LV 8.x or 8.20.
-
- Events Mouse Down and Mouse Up give you information if something is dragged on the control
- MCListbox >>> Invoke node >>> Point to Row Collumn gets you information where on the control mouse down and mouse up occurred (row, column) but doesn't tell if anything was resized
- You can however see if something was resized from the fact that the control FP image changes, so by comparing the image of the control from Mouse Down Event and Mouse Up event you know that the control has visually changed.
- If both mouse down and mouse up occurred on row -1 and same column, you know that the visual change cannot be due to anything else but resizing (if user cannot change header row strings)
- From mouse down and mouse up event Coords you can then find out how much the column was resized
Complicated but should get you there... Perhaps you want to post the final solution to the code repository
Edit: I wrote you a functional example
Jimi,
This is a nice trick (I can't believe there is no easier way to do this!). However, the attached VI appears to be non functional when the mouse up event does not appen on the header (ie, when you finish resizing inside the MCListbox but not over the header).
Also, for performance sake, I would set the image depth of the get image method to 1 (Black and White).
PJM
-
Here is the windows direct link and the mac direct link.Just released toolkit for NXT for LabVIEWPJM
-
I think you can't debug a CIN while LabVIEW is running.
Note: I am not 100% sure
PJM
-
Jimi,
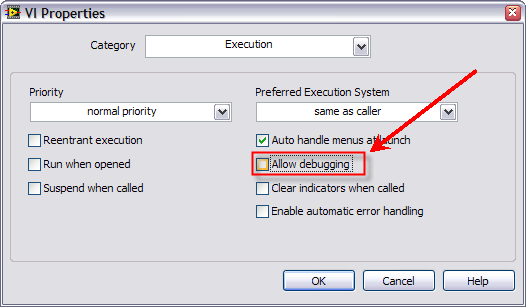
Did you try my suggestion to uncheck allow debugging in the reentrant VI(s) that prevent your project from opening? Did it had any effect?
PJM
-
Just a quick comment.Thanks for chrisdavis' help and suggestion.NI DAQ card is much expensive than Advantech product, and I selected the Advantech PCI 1711,using the Windows 2000 and LabVIEW 8.0 platform, and I want to use VC++6.0 to write a program to drive my DAQ card.
As you known, DAQmx only support NI cards, so I must write the drive program although Advantech has given the demos for common function such as AI,AO,DI,DO etc. But they have their disadvantages,especially they can not support more complex function.For example,use Timer to creat more precise signal. So I want to use C language to build my program to accomplish my purpose.
OK,I will connect NI for more information.
Thank you again,chrisdavis,thank you!
In most situation, trying to save money on hardware not compatible with LabVIEW will most likely end up costing you money for the time spend to do the driver development and testing.
PJM
-
While changing the menu or text ring to embed the string info will be good for my LV usage, I can see why this could potentially create problems in other people existing code.I would rather see the option of creating enums where the values of the strings do not have to be sequential. Is this not why ring constants are used instead of enums?I fear for nasty bugs in existing projects when you change the behavior of a ring constant.
Also execution speed could be inferior by adding extra features.
The string info is not part of the data-type, please leave it like that. Please note that the combo box has a similar behavior.
The reason why I was using the ring constant was to create a sparse enum, so if we had the ability to have enum with non sequential string this would cover most of the use case (if not all) I may have for using a menu/text ring constant.
PJM
-
Jimi,...LabVIEW either crashes or freezes or claims that "cannot copy reentrant dataspace" depending on how I try to open the project. I have a backup from yesterday which I could revert to, but as this is a bug that keeps occurring again and again, I'd like to finally know why this bug occurs to be able to avoid it. ...I think this particular issue is due to the debugging capabilities of reentrant VI in LV 8.x. I have seen it many time both in LV8.0x and 8.2 (although less in LV8.2) and this was happening only when I was debugging a reentrant VI. I think you may be able to alleviate the issue by unchecking allow debugging of the culprit reentrant VI.

Note: I have not checked whether this work or not.
PJM
-
This is a good trick.This doesn't solve the problem, but if you do need to force your constants to update, open the strict type definition, change the representation to some other data type (ie, U16 to I32), apply changes, and then change it back. This was mentioned in an Info-LabVIEW post a year or so ago.Thanks
PJM
-
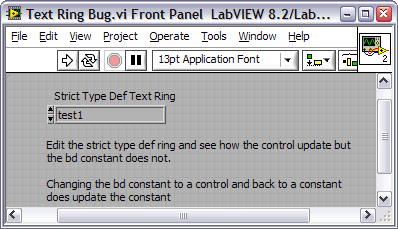
Editing a strict type def ring does update controls or indicators instances but does not update constant instances.
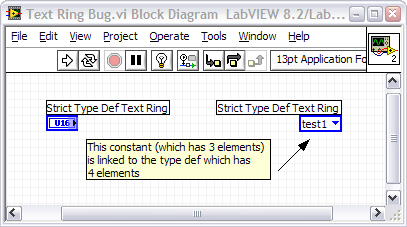

This is a severe bug in my opinion, as it make using ring text constant unusable on block diagram (since for every edit you have to fix all of your constants instances. You loose the entire benefit of the typedefness [is this a word?]).
See example below that demonstrate the bug.
Download File:post-121-1163454674.zip
PJM
Edit: Apparently this may not be a bug but an expected behavior. I knew there was a reason why I though that I should never use either text or menu Ring.
-
I like the improvemnts to the auto-wiring functions. INI file functions will wire both the erro cluster and the file ref. Good.
The "Insert" is also smarter. Click on an error cluster wire and do an "insert" it wires the cluster. Nice.
Ben
Cool info Ben. The insert>bundle by name or insert>bundle is working as expected now. Nice :thumbup:
Too bad that while they were at it, they did not fix the insert>unbundle by name or insert>unbundle.
But this is nice that NI is finaly working on the insert menu (and it need a lot of work).
PJM
-
I though it was part of the LabVIEW DSC package, but I may be wrong.OK, folks, what am I missing here? I have PDS 8.0 and 8.20 installed on my laptop, and I don't have a 'Graphics' folder under my 'Shared' folder. Does this come with a toolkit I don't have, like Vision?...
PJM
-
See this post
-
The separator are not displayed properly when the right click is done over a pane (see images).
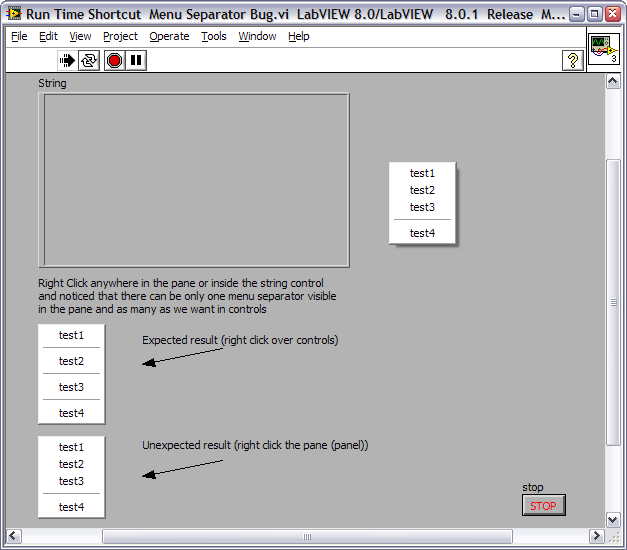
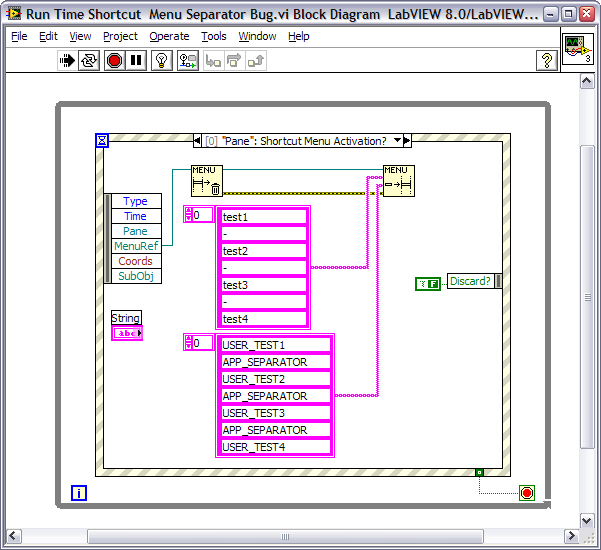
This is a bug present in both LV 8.0 and 8.2.
Note: See attached VI for a demnostration of the bug.
Download File:post-121-1163364438.vi
CAR # for this bug is: # 43CGK1U4
PJM
-
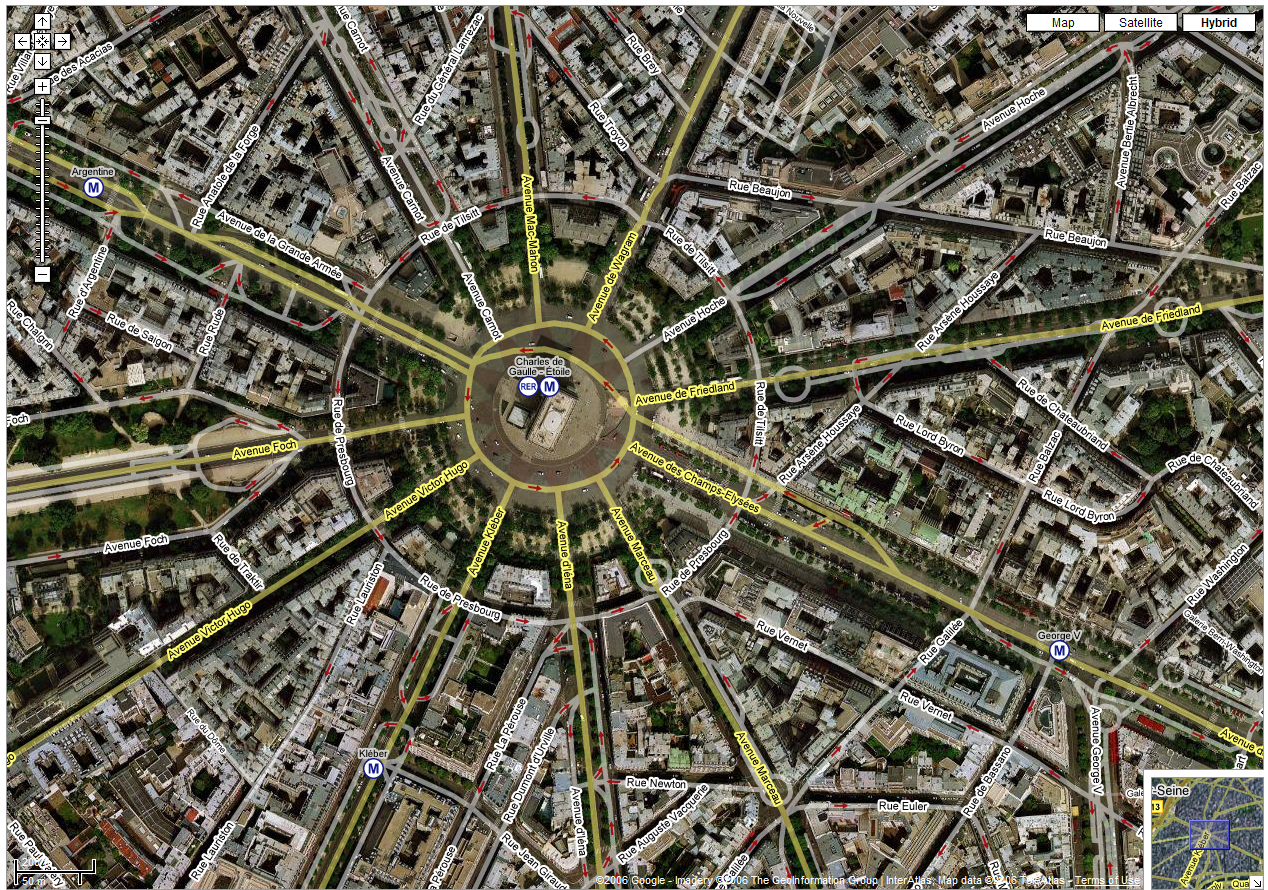
Just a side note, the correct name is Tour Eiffel (or Eiffel Tower for the English speakers) named after the engineer Gustave Eiffel.
PJM
-
OK, Michael, care to tell us where that image is located? Just curious.
I'll give you a clue

PJM


Delayed control scaling on Panel Resize
in LabVIEW Bugs
Posted
I would argue that this is a bug. I have come to expect the behavior that Michael mentioned (fit as you drag) in LV 8.0x. If this this not a bug, then where was it documented that this was changed? I don't remember reading anything about it in the upgrades notes. If there are 2 possible behaviors, then I would expect to be able to access both programatically. In my opinion, resizing the windows content after you have finished resizing the Panel is the wrong behavior. I can not, on the top of my head, think on any applications that follow this behavior in windows.
PJM