

Michael Aivaliotis
-
Posts
6,217 -
Joined
-
Last visited
-
Days Won
120
Content Type
Profiles
Forums
Downloads
Gallery
Posts posted by Michael Aivaliotis
-
-
-
I know Bryan hangs out in the forums and has worked on TCL stuff perhaps you guys can exchange notes.
http://forums.lavausergroup.org/index.php?...=findpost&p=804
http://forums.lavausergroup.org/index.php?...=findpost&p=802
-
OK Sarah, I hope we can finaly close this thread. :thumbup:
Here is some code that will help you out. I think I understand what you require now.

Download File:post-2-1095480616.llb LV Version 7.0
-
Well that's a neat trick! :worship:
This normally generates an error in LV (broken wire). You can't have the output of the array feeding into the equal function. Object is member of a cycle.
"These wires form a cycle, making two parts of the diagram interdependent, so each must wait for an input from the other and neither can execute."
I assume there is something else you're not showing us...

-
-
Can you post an image of your diagram where this VI is used? It looks like your "replace.vi" is working fine from what I can see on the front panel. How is this VI used in the caller?
-
Check out the FAQ entry here:
http://forums.lavausergroup.org/index.php?...=findpost&p=679
-
This is not exactly a good post but it shows an example of how to do an event callback:
http://forums.lavausergroup.org/index.php?...=findpost&p=119
Perhaps this question should be put up into the LabVIEW FAQ...

-
That's great! I'll move it over to the LabVIEW FAQ in a few days...
-
See Here:
-
Seeing is that web documents come and go. I'm including the entire press release in this post:
Court of Appeals Upholds Patent Infringement Judgment against The MathWorks, Inc.Tuesday September 7, 2:02 pm ET
Decision Affirms Jury Verdict in Favor of National Instruments Finding Infringement by Simulink and Related Products
AUSTIN, Texas--(BUSINESS WIRE)--Sept. 7, 2004-- National Instruments (Nasdaq:NATI - News) today announced that the United States Court of Appeals for the Federal Circuit has affirmed the judgment of infringement of three National Instruments patents by Massachusetts-based The MathWorks, Inc. The patents, U.S. Patent Nos. 4,901,221; 4,914,568; and 5,301,336, relate to National Instruments LabVIEW software, which contains major innovations in programming design tools. A fourth patent, No. 5,291,587, was found valid but not infringed.
In June 2003, the Honorable T. John Ward of the District Court for the Eastern District of Texas (Marshall Division) upheld the jury's January 2003 verdict finding validity and infringement of National Instruments' patents, and issued an order forbidding the sale of The MathWorks Simulink software product once any appeal has been disposed of in favor of National Instruments.
"We are pleased that the Court of Appeals affirmed the verdict," said David Hugley, NI vice president and general counsel. "LabVIEW has had a revolutionary impact on scientists and engineers with its innovative virtual instrumentation approach. We have invested heavily in the intellectual property in LabVIEW and the Court of Appeals ruling further protects and validates our intellectual property."
National Instruments continues to offer the LabVIEW Simulation Interface Toolkit, which adds the LabVIEW user interface to the Simulink environment. With the LabVIEW Simulation Interface Toolkit, design engineers can use LabVIEW-based user interfaces to intuitively control and view data within their control models. The toolkit gives The MathWorks customers a licensed manner to control and view Simulink data under these National Instruments patents.
The final royalty damages will be recorded in the financial statements of the company after the issuance of the Court of Appeals written mandate and the release of the escrow. The company anticipates using a significant portion of the proceeds to fund academic research and classroom projects for improving science, technology, engineering and mathematics education.
About National Instruments
National Instruments (www.ni.com) is a technology pioneer and leader in virtual instrumentation -- a revolutionary concept that has changed the way engineers and scientists approach measurement and automation. Leveraging the PC and its related technologies, virtual instrumentation increases productivity and lowers costs through easy-to-integrate software, such as the NI LabVIEW graphical development environment, and modular hardware, such as PXI modules for data acquisition, instrument control and machine vision. Headquartered in Austin, Texas, NI has more than 3,100 employees and direct operations in 41 countries. In 2003, the company sold products to more than 25,000 companies in 90 countries. For the past five years, FORTUNE magazine named NI one of the 100 best companies to work for in America.
Readers may obtain investment information from the company's investor relations department by calling 512-683-5090, by sending e-mail to nati@ni.com or by visiting www.ni.com/nati.
LabVIEW, National Instruments, NI and ni.com are trademarks of National Instruments. Simulink and The MathWorks are registered trademarks of The MathWorks, Inc. Other product and company names listed are trademarks or trade names of their respective companies.
Contact:
National Instruments, Austin
Editor Contact:
Jennifer Howard-Brown, 512-683-8713
Source: National Instruments
-
I know Bryan is another car lover here. Personally, I really don't get it. How can somebody spend so much money on a car. I guess that's why it's called a hobby.
It must be great living in Germany since it's easier to have a BMW as a car. Here in North America, they are called imports of course and are really expensive.
If you had to choose between your boyfriend and your cars, who would you pick?
-
Take a look at the attached code (lv70). I added the shift register. This is what I meant. I am also using the standard XY Graph.
Download File:post-2-1092361238.vi
-
Actually, you CAN edit your own posts. However you have a time limit of 60mins. to do so. In other words, you have an hour to realise that you shouldn't have wrote that... Beyond that, a polite personal message to me with a justification will do it.
-
You use the same method that you would normaly use when accessing a VI within the same labview.
Also, when communicating to another executable then you need to specify "localhost" as your servername. VI Server uses the TCP/IP protocol. TCP/IP communications between two executables require that each end of the TCP/IP link has a different TCP/IP port number. When the two VIs are running under LabVIEW, they are within LabVIEW (in other words, not communicating between executables or separate programs).
You can change the port number in the ini setting for that executable. The .ini file should have the same name and be in the same directory as the executable.
A typical ini file after the port has been changed on the executable looks like this:
[MyExecutable]
server.tcp.enabled=True
server.tcp.port=3364
server.tcp.access="+localhost"
Also, one more thing. If you want to test your code before you create an executable, you can launch multiple instances of LabVIEW. I haven't tried this but it's shown in this post in the FAQ:
Can I run multiple instances of LabVIEW?

-
I opened the code in LV7.1 and re-saved it in 7.0 for the rest of you.
I am attaching it.
As far as the code itself. I would recommend that you create 1 serial IO VI and reuse that. It will make your code easier to manage and read. Also, try to keep your diagram to a limited space like 1024x768 screen resolution. My desktop is 1680x1050 and I still couldn't fit everything on there. When I get a chance, I will try to submit a revision to your code but in the meantime, maybe others can make some suggestions.
As related to your original question. I think if you create a few sub-vi's as I suggest, you will see that it will solve your problem.
-
When you create an exe file, LV automatically sets your main toplevel VI to run automatically. What radio button are you talking about?
-
-
An easier way is to just right-click on the boolean and create a property node just for the boolean.
You can use the Strings array property to specify the number of items.
-
Yes, this is possible. No right-click required. Just go to your Dialog pallete and select an additional radio button. Drag it over to your radio button area and drop it in. You can drop in as many radio booleans as you require.
-
I would suggest you perform a search in the forums before posting. This will help you resolve issues faster.
In regards to your question about launching a VI, I suggest you read this post:
-
Which example is that? Could you let us know so others can benefit?
Also, is there a reason why you are using the xy plot with picture control? It's more efficient and easier to use the standard XY graph indicator on the graph pallette.
-
-
Ok, I think I got it now. One question, do you absolutely require editing of the numerics? If not, then you can just convert the numbers to strings and feed them into the listbox. If you require editing then a better approach would be to use an array of numerics than a listbox. If you want to have a scrollbar then you can use the technique described here:Sorry, my English is poor. I try to explain my condition again. There is a example. In my user interface, in special reason I want to put the Numeric 13 under the Numeric 12 on the listbox 2 and use scroll. The listbox can accept strings and it can use scroll. Is there have any methods can put the Numeric 13 under the Numeric 12 on the listbox 2 and use scroll?
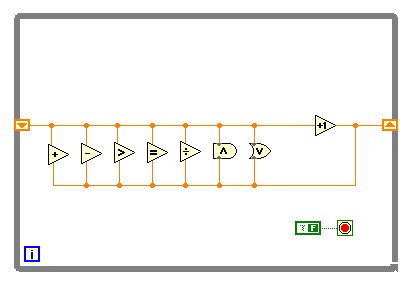


What's wrong with this VI?
in LAVA Lounge
Posted
Ah, yes. It reminds me of those visual optical tricks you read in puzzle books. The optical illusion here is the idea that data always exits a VI on the right-hand side. This forces your eye to follow the data from left to right. What you don't notice is that the constant "2048" is wired to ALL locals...
I hope you shot the programmer...