rob.dye
-
Posts
4 -
Joined
-
Last visited
-
Days Won
3
About rob.dye

Recent Profile Visitors
2,927 profile views


rob.dye's Achievements
")


-
Back in 2015 the LV profiler on Windows used an older, lower resolution time API that I believe could return timestamps that would result in negative deltas. Using unsigned arithmetic would result in gigantic time deltas like this. I believe it was LV 2017 or 2018 that was upgraded to use the QueryPerformanceCounter API for these timestamps, which has much better monotonicity and higher resolution. Rob Dye, NI LabVIEW team.
-
@EvgenKo423: I don't know all the ins and outs of the SH implementation, but I do know that above a certain size threshold (I thought it was 64KiB) SH will just alloc straight from the Windows API (VirtualAlloc, I think). SH doesn't do any other management of these blocks, so when LV asks SH to free them, SH immediately calls VirtualFree. This reduction in mem footprint should be visible in Process Explorer (or Task Manager). Another complication, though, is that a performance analysis done by our NI Bangalore colleagues found that VirtualFree was quite an expensive operation, so I believe LV's memory manager layer currently keeps a small cache of freed large blocks in order to avoid the VirtualFree penalty when possible. As I said, these things are complicated. This cache was found to be effective in RFmx applications where large waveforms are being constantly allocated, resized, and freed.
-
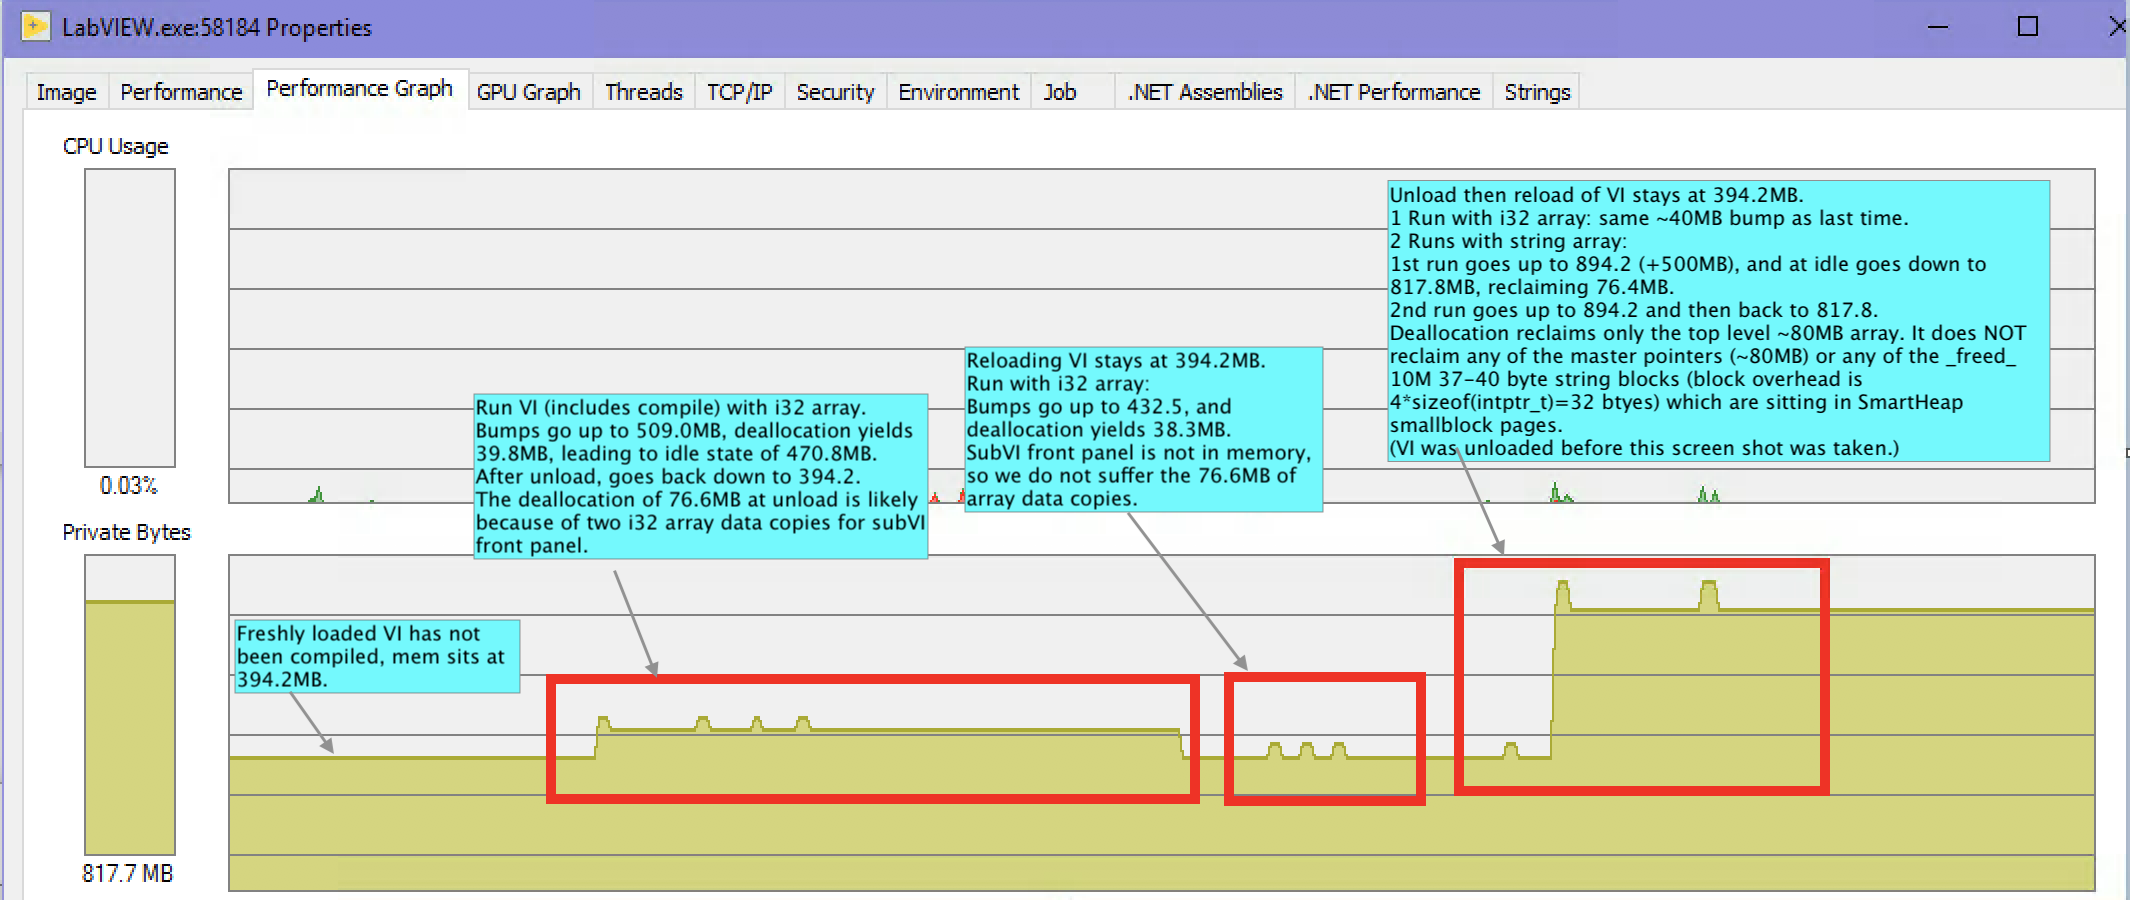
TL;DR: This is NOT a bug. It is all explainable by the normal behavior of the memory management mechanisms used by LabVIEW, including a memory allocator layer provided by SmartHeap (from MicroQuill). Details: Actually the original bug report in Dec 2013 by Mr Mike (bonjour, Mike!) was pretty accurately analyzed and documented by Ryan P in 2014 and the bug was closed then. Mike's post from today did manage to gain the attention of someone else at NI, who asked me to take a look. I reviewed the VIs from this page and decided I could explain all the behavior with actual numbers. See the enclosed picture of Process Explorer's trace of LabVIEW 2019 (64-bit) memory usage during a session looking at these VIs. The labels I've placed in the picture attempt to explain it all, but I'll summarize by saying that all the "lost" memory (around 422MB) can be explained by the 10M master pointers managed by LV, plus 10M _freed_ small blocks sitting in pages managed by SmartHeap. These _freed_ blocks are not "lost". SmartHeap knows where they are and will let us use them again, although because they are small SH keeps them in special low-overhead pools that are used _only_ for small allocations, and who knows when LV will need 10M small blocks again. These _freed_ blocks were formerly the 10M strings with one "space" character in them, each of which actually take up probably 40 or 48 bytes. Each string block has a LV-managed 32 byte header, plus a 4 byte length, plus 1 byte for the "space" char. LV asks Smartheap for this 37 byte block, and they probably give us a 40 (rounded up to multiple of 8?) or 48 (rounded up to multiple of 16?) byte smallblock to contain our request. Small blocks in SH are low overhead because they only require a single bit to represent their inUse state and require no header of their own. The numbers don't all add up exactly, but they are sufficiently in the ballpark that any slop is explainable by the the fact that a lot of other stuff is going on in the memory management arena in LV. It's complicated. There could be significant amounts of fragmented small free blocks already available. Process Explorer could be reporting in mebibytes vs. megabytes. etc. Hope this helps. Rob

-
I came here looking to see what the G experts have done wrt timing probes and found this discussion of High Resolution Relative Seconds.vi (HRRS). I am the person responsible for putting this VI in vi.lib/Utility. It calls back into a utility function I put into LV, which uses the same API that is used by the Desktop Execution Trace Toolkit. I intended it to use the highest resolution clock available on all of LabVIEW's supported platforms. On Windows this means QueryPerformanceCounter, which, in modern versions of Windows, takes into account multi-core/processor issues as well as variations in clock rate due to power management. (Up to date and authoritative docs on this are hard to find, but from the googling I've done, I believe my claim is correct.) This I discuss some of the behavior of HRRS at this site at ni.com: https://decibel.ni.com/content/blogs/EvanP/2010/10/04/tick-count-us--microsecond-timing-granularity-on-windows (I notice some of the picture links are busted there - I'll try to fix them.) As some of you noted, the Wait (ms) primitive is the inaccurate/inconsistent culprit in the Mr. Balla's benchmark. It uses a less accurate clock API, but one that uses the same clock as the "Get Date/Time in Seconds" and "Tick Count (ms)" primitives. Rob Dye LabVIEW R&D