-
Posts
951 -
Joined
-
Last visited
-
Days Won
39
Content Type
Profiles
Forums
Downloads
Gallery
Posts posted by jcarmody
-
-
I was wondering about this JUST YESTERDAY!!!! Really.

-
Hello guys,
First of all, I am glad to be here. I am a beginner at LabView (2009).
Second, I was suggested this site by a friend of mine in case I need help with LabView.
Third, I need HELP! hehe
Ok so I want to create range of number associated with another number.
i.e. Numbers 1-10 should be assigned value "1"
Number 11-20 should be assigned value "2"
and so on.
I want to compare my number with the range if it falls into the range, I want to assign the value assigned to that range.
i.e. # I have is 15 and I want to compare it with each range. Since 15 falls in between 11-20, I want to assign it # 2.
I am not looking for answer or code. All I want is an idea in the right direction. i.e., what types of things I should consider for creating different ranges and assigning them with numbers.
Thanks
First of all, welcome.
Second, you've come to the right place.
Third, think about what you get if you divide the input number by the size of the range. For your example, divide 15 by 10 and consider the result. Try a few other numbers and you'll see what I'm getting at.
(hint: Quotient & Remainder) Highlight the text before this line for a dead giveaway...
Good luck.

-
Here's a place to start - http://lavag.org/fil...e/68-skype-sdk/
-
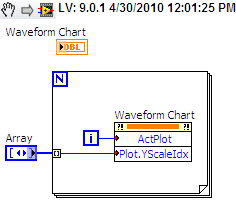
The array contains an enum (values: Scale 1, Scale 2) with one element for each plot.
EDIT - Why in the world is my snippet so large? This has never happened to me before.

-
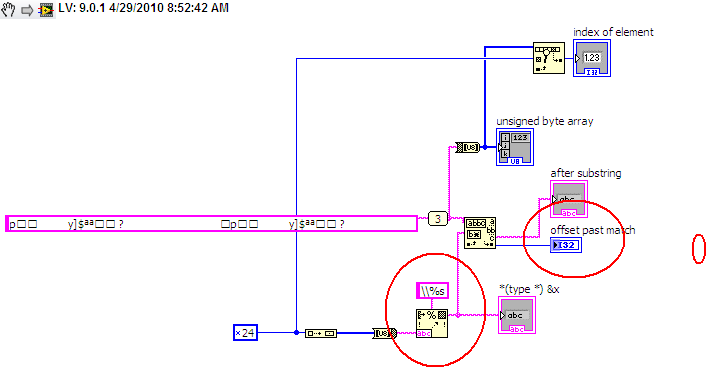
Hex 24 = $ which is special character for the match pattern. Check the help on Match pattern and look at "special characters"
Ben
I used a Format Into String to escape the special character and it works correctly (you need to escape the escape character in the format string in order to get the escape character into the Match Pattern, hence the two "\"s). The "offset past match" will be one more than the "index of element" from your Search 1D Array.
-
For things where you really want to make sure the user notices it, you're better off with a custom dialog which looks different (large, bold, red font tends to work).
I had a
 situation yesterday where an operator ignored the large, bold, black-font-on-yellow-background dialog that told them they were doing something wrong. When a downstream process failed they told the line-leader that they ignored the warning because they "thought it was all right".
You can't fix stupid everything.
-
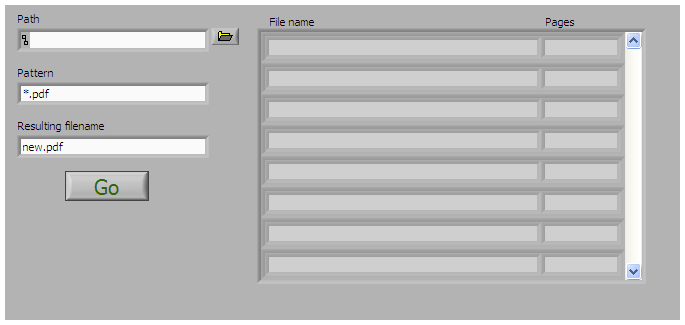
I did this a while ago to merge PDF files using pdftk in LabVIEW. Put the path to the directory containing your PDF files into the Path Control, add a filter (*.pdf is good) and a name for the new file. Run the VI, select the pages from each PDF file to go into the new file, press "Go" and Bob will be your father's brother.
-
People expect a close button; the red "X" makes them feel safe. There's the feeling that "If I don't like the options the program gives me, I can always cancel." I don't take it away from them, I handle it. This way the see what they're accustomed to seeing.
-
It would be nice if we could drag and drop a case name into the VI.
For instance by selecting a case with the 'ctrl' down.
This would not show the case, but allow for a drag and drop of the case name.
If you drop this into a string constant it would contain the name of the case you selected.
Ton
Ton,
I tried this but gave up when it didn't fall into place quickly, but I have uploaded CaseSelect 2.0.0 which contains my interpretation of your suggestion. It works by selecting the String Constant you want to add new cases to, you then double-click cases in CaseSelect to add them to the String Constant. I think it's faster this way than do drag-n-drop; it sure was easier to implement. It does switch cases as you click, but you can use the right-click context menu to highlight the selected String Control when you're done.
I've also added a feature to the renaming function. It finds all instances of the case being renamed and replaces them with the new name.
Jim
-
I would like to have all of these values be the same on the separate tabs at the same time.
For example if I press one of the boolean controls, that same boolean control should now be activated on the other tabs as well.
If it would be possible, please do point me in the right direction of how to go about doing this. (Also the proper terminology)
Many Thanks,
Buffalo960
You can use Local Variables or Property Nodes in an Event Structure to update the controls on the other tabs but, if you're always going to make them equal, you can put them over the Tab control (instead of on a particular tab) and show/hide them as appropriate. Put them over the control by placing them on an empty part of the Front Panel and move them into place using the arrow keys.
-
Hi all,
I want to be able to extract the text from PDFs from within LV.
I found this post a few months back and wrote this VI to extract text from a PDF file. It uses PDFBox, which is "is a Java PDF Library [which] will allow access to all of the components in a PDF document."
-
Thanks a lot for the comments.
Any idea about how to connect with a database sitting in a different computer? Now i am connecting by creating a datasource, as the database is in my PC. Now, when i put the database in another PC, how can I connect with the database? How should i link? Is there any way that i can specify server's IP address and database's location in the UDL file?
Skip the UDL file altogether and wire a connection string directly into the Open Connection function.
-
 1
1
-
-
Sort of, but you would have to build it yourself. Both the BD and the FP have a property called Selection List[] which returns an array of reference to all selected objects. You can go over all the objects in that list and get or set their tags.
Is there a way to find the tags if you don't already know the names? The Tag.Get Tag method requires a Tag Name.
Stardom, this is a way to get the SelList[] using a VI kept in the Projects folder.
-
This has already been started at
Avinashgogineni hasn't provided any method of validating whatever program you develop. We've provided at least three VI's that do what's been requested, but can't know what's correct without a better definition of the problem. I guess someone could keep writing until they stumble upon a solution that's accepted...
The only way I'll EVER develop software without a good problem definition is when my boss tells me to. Nobody else can make me do it! It's too emotionally draining.


-
 1
1
-
-
I have several channels worth of data.
I want to be able to have a horizontal bar plot where each bar represents the RMS value of the channel.
I also need to have some kind of marker to mark the peak value.
Anyone have any experience with bar plots in LabVIEW? I've done a little research and I haven't found a lot. It doesn't seem like it should be this hard.
There's a relevant post here that includes an example with horizontal and vertical bar charts.
-
Not only CSV, i am unable to read any data.. please some one help me here... so that i can move farward..
Ton mentioned that the decimal separator may be an issue. We use a "." here; what do you use? Have you tried Ton's suggestion to save the Excel sheet as a tab-delimited text file?
-
Bzzzt - paying someone to complete your assignment is, IMHO, unethical. I think you'll find it difficult to find someone here to do it for you.
We could provide obfuscated code.
 That'd be funny.
Hi Please help me in that.. I have some confidence that I can Complete that Project....
Have you determined how many peaks your sample data contains? How do you know that what you already have isn't exactly what you need?
-
Hello Jcarmondy,
I have done this one. Please see this and tell me how can i connect the bundle and wave form graph. So, that i can follow your instuction
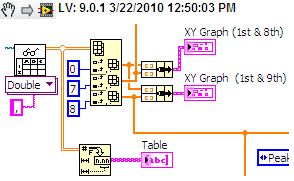
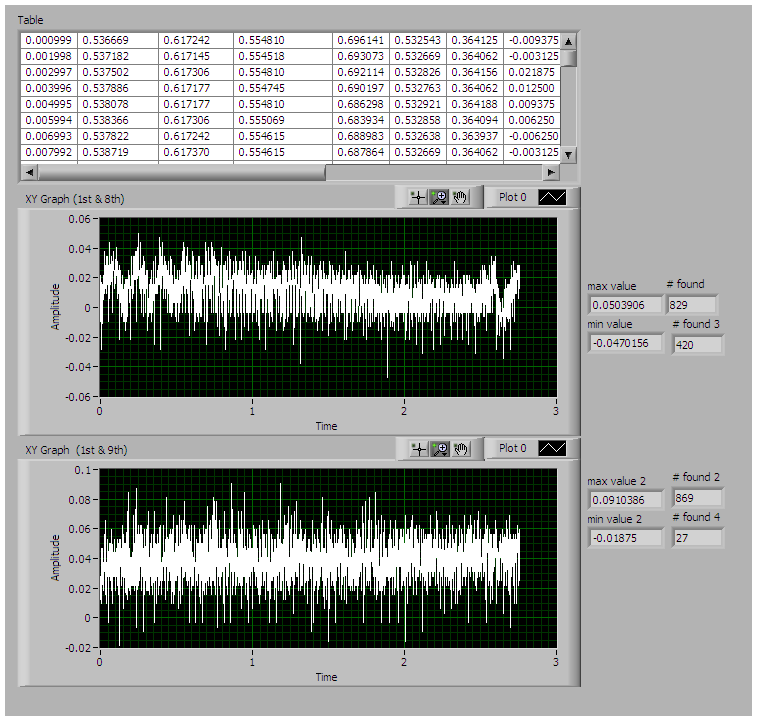
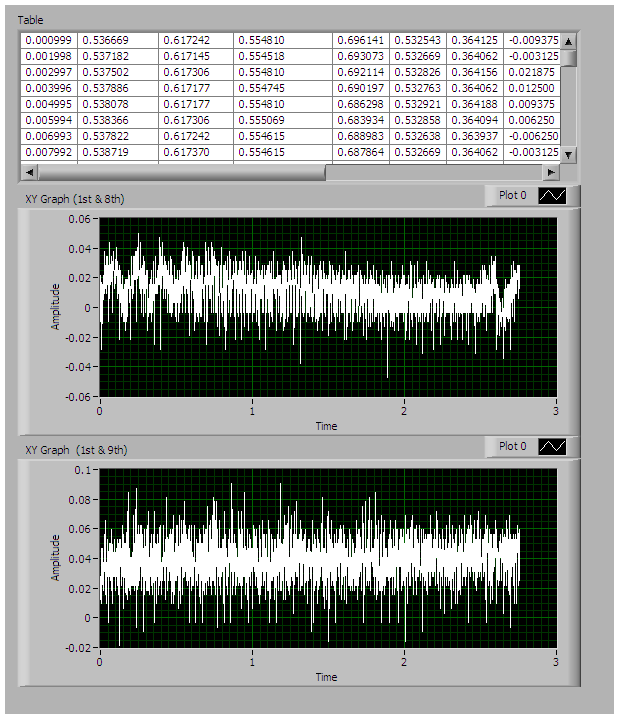
Like Ton said, they're XY Graphs. You could have dragged my snippet into your (LabVIEW 2009) block diagram and you'd have had the right indicators automagically. Take a look at the LabVIEW Help on "graphs, types" (in the index); it has a good overview of the different graphs & charts and the data that they'll accept.
You did the peak detection as I did, but you may need to play with the Width and Threshold values for your application.
-
Ya sure.. I am posting my code document... here please see this.
Here's the beginning.
Like I said before, you need to specify your requirements for peak detection better. Perhaps you could manually detect peaks from your sample data and compare my results in the screenshot above. I used the Peak Detector.vi, but it may not be what you need. See if you can implement this from my snippet.
-
I haven't seen this in 2009, but I used to see it all the time.
-
- Popular Post
- Popular Post
I apparently have lower overhead (or a lower estimation of my own value) so I do side jobs for $75/hr! But, if you post your code we can help you work through your problem FOR FREE! You can't beat that price anywhere, and you won't be guilty of academic fraud. Besides, if you graduate without knowing the material you may end up working with me and I'd have to do your work forever.

-
 3
3
-
Actualy I want that block panal please can you mail that to my id? avinash.gogineni@gmail.com
Two things:
1) I didn't post my code because you didn't post yours. I don't work for free (but I will do my best to help).
2) I don't trust my peak determination. You'd need to validate the results against a known data set.
c) My program is at work and I'm at home.
-
-



Need a Labview Project
in LabVIEW General
Posted
Write a program to test the Overheat and Fire Detection control cards for the 747-8 aircraft. Then I won't have to do it.