

MikaelH
-
Posts
835 -
Joined
-
Last visited
-
Days Won
49
Content Type
Profiles
Forums
Downloads
Gallery
Posts posted by MikaelH
-
-
Ulf,
The GDS is tested with AutoIT, it takes about 24 hours to test through 6 versions of LabVIEW, and I'm glad I don't have to do it manually.
I've even cerated a AutoIT application called StartUp.exe, which I configured as the windows shell.
This small application made sure my LabVIEW application always was running and if not, it started it.
I also have this application to silenly install LV2012 RT eninge if needed.
You can almost do anything with AutoIT, It's a great tool.
Cheers,
Mike
-
Cool!
You are of course refeering to my post-signature, Yes, I'm very happy with the design ;-)
-
 1
1
-
-
FYI we are working on documenation that soon will be ready.
Here are just some images of what's new, (an image says more than 1000 words, and I don't have time to write to much right now)
------------------------------------------------------------------------------------------
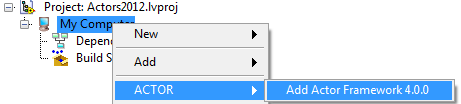
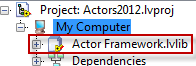
To activate the ACTOR framework menus in GDS, you have to add the Framework library to the project.
One easy way is to right click on My Computer
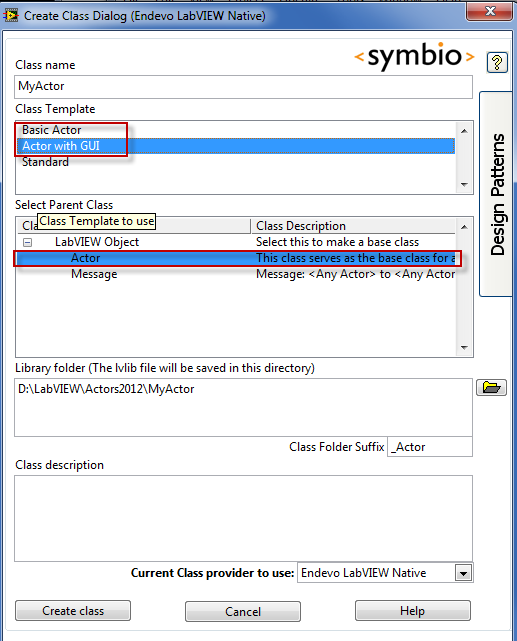
When creating a class select to inherit from an Actor, and select a class Template
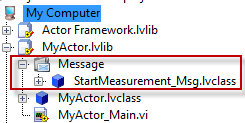
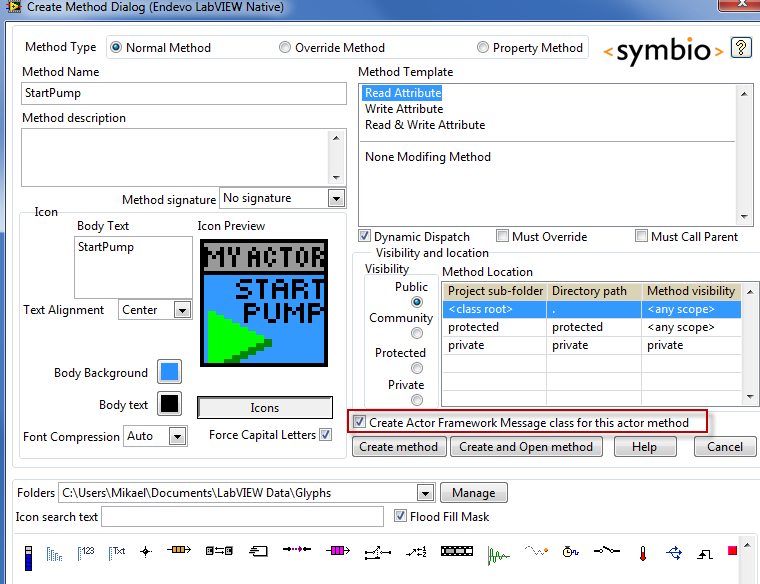
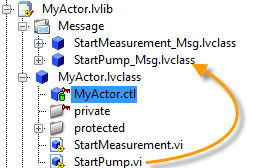
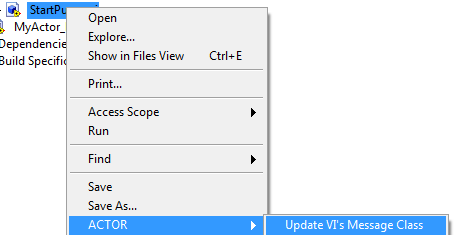
When creating a class method in an actor class, the “Create AF class for this actor method” will be pre-ticked.
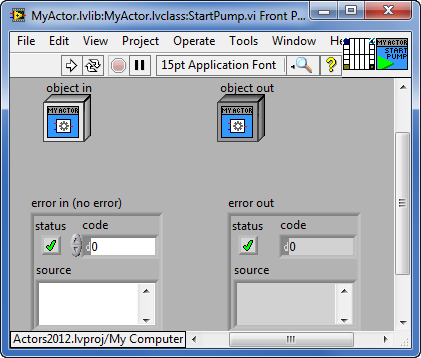
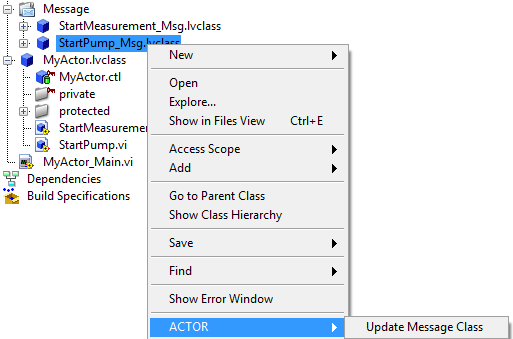
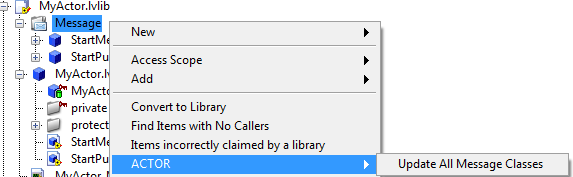
If you change the connector pane of a method, you need to update the message class.
 To
To 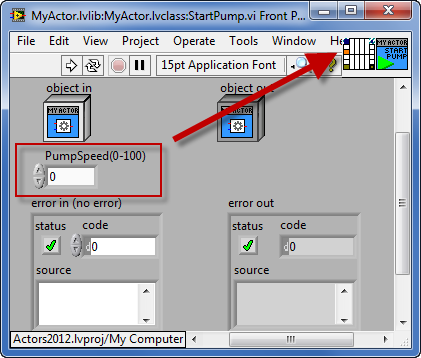
Then do:
..or..
..or..
We’ve added some extra Actor analysis in the UML modeller.
Other functions that is added are:
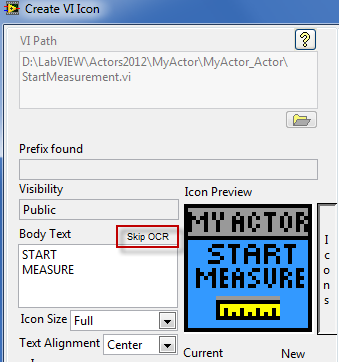
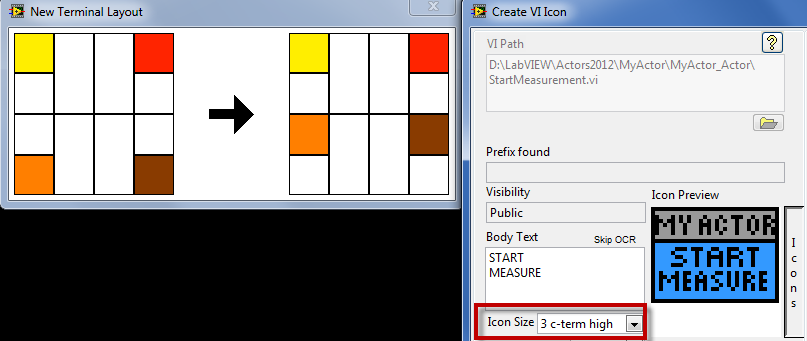
For Icon editor:
TEXT OCR
Icons/glyphs support
Smaller icons

Cheers,
Mike
-
1
-
-
Mike, thanks for the information.
Regards,
Ajay
No worries, keep your eyes open and you'll soon see the release on GDS 4.5 :-)
-
I've had to use the method och storing the lvclass content in a string constant on the block diagram and write it to disk and then use the LvClass.Open invoke node.
-
Can anybody explain about "Active Object: Queues to and from process" design pattern?

As I am new to these GOOP and learning design patters to apply for my project, I would like to have some description about "Active Object: Queues to and from process" design pattern.
Maybe this video will help you out:
http://goop.endevo.net/GDS/videos/DesignPatterns (you can fast forward to 4:40 to get to the Active Object implementation)
If you still have any questions, let me know and I'll help you.
//Mike
-
I must admit that Siri is now working much better on my wife's new IPhone 5 ( I just tried it).
I guess that they've used LabVIEW to test it.
-
the latest bug fix for Siri had an explicit fix for Australian accents listed in the upgrade notes.
But it only work if you talk like Mick Dundee

-
I'm uploading a new beta version right now(it will take an hour or two to get it up), the download URLs are here:
http://goop.endevo.net/GDS/GDS_Q9G_2010.zip
http://goop.endevo.net/GDS/GDS_Q9G_2011.zip
http://goop.endevo.net/GDS/GDS_Q9G_2010-64.zip
http://goop.endevo.net/GDS/GDS_Q9G_2011-64.zip
-
Alpha = Doesn't work.
Beta = Still doesn't work.
But also a Beta release could be 100% working verison that you want to get out there before you have had time to finish off all boring documentation.
-
that''s right, but anyone could help me solving the problem? Thank you all
Sorry, we got into another discussion there :-)
So back to your original question.
"how to visualize the frequency as X and amplitude as Y? "
When using a FFT power spectrum, the X axis is in frequency.
It starts at Frequency 0 Hz and every x value has a delta f increment.
-
So be careful offering to recreate copyrighted code.
Sure, I wouldn't do it, but it's very hard to know where the line goes sometimes.
Especially for the PID VIs, there aren't many ways implement it. And if you haven't looked at the source code your code might end up looking very similar anyway.
-
I've not found any Australian friends here down under that are happy with their Siri, probably because our accent down here :-)

-
more than one of them failed.
I guess Siri if one of them ;-)
-
Yes you do!
Okay, If I open the VIs memorise it and then rewrites it without looking at the code while doing it, is that also a breach?
-
If you can make up a VI that simulates the HW-signals, it's easier to help you out and for me to understand what you are looking for.
-
If you need to plot a frequency spectrum, you should use FFT Power Spectrum.
-
I need to graph the spectrum of the temperature wave..
I did the amplitude and phase spectrum but anything changed: no graph visualized..
How to do that?
I don't understand what you mean.
Do you just need to plot the temperature?
In my PID graphs, I normally plot the Control signal (maybe voltage 0-10v) and also the temperature.
I use different Y scales for the two plots.
-
I'm just wondering, since the LV PID Toolkit VIs are not block diagram protected, so if I just take the content and copy it on a new VI's block diagram, and send you that VI, do I then breach any copyright laws?
-
I think you might still end up with interlinking problems at least in some versions of LabVIEW.
It works fine for me in LV2010, I just build my exe file in LV2010-32 bit, then I open the same project in 2010-64 and builds it again without any problems. Maybe I've just been lucky :-)
-
I've solved exactly this problem with the "TARGET_BITNESS of a conditional disable structure".
I just open the same VI with LV 32 and 64 bit version to configure the dll path.
I always create 2 folders "32" and "64", where I have the dll's with the same name.
//Mike
-
FYI
Sometimes I solve these kind of problems by using reference based objects.
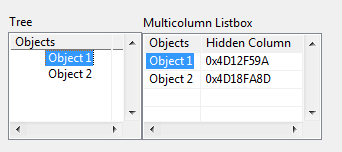
If I use a Tree control I store the object reference as the tag, and for a Multi Column list box, I can store the reference in a hidden column the user can't see.
-
If you just want the speach recognition function, look at LVSpeak
-
...and also the upcoming version supports many more classes in the Project Windows and the UML Class diagram for the community user.
-
1
-

Automate test of a built application
in User Interface
Posted
The Auto IT script supports attachment of files, it auto zips it and can extract them for your very quickly.
The RT engine is at about 200M, and I think it got down to 150M for everything in the AutoIT-exe file.
//Mike