Leaderboard


Popular Content
Showing content with the highest reputation on 07/16/2020 in all areas
-
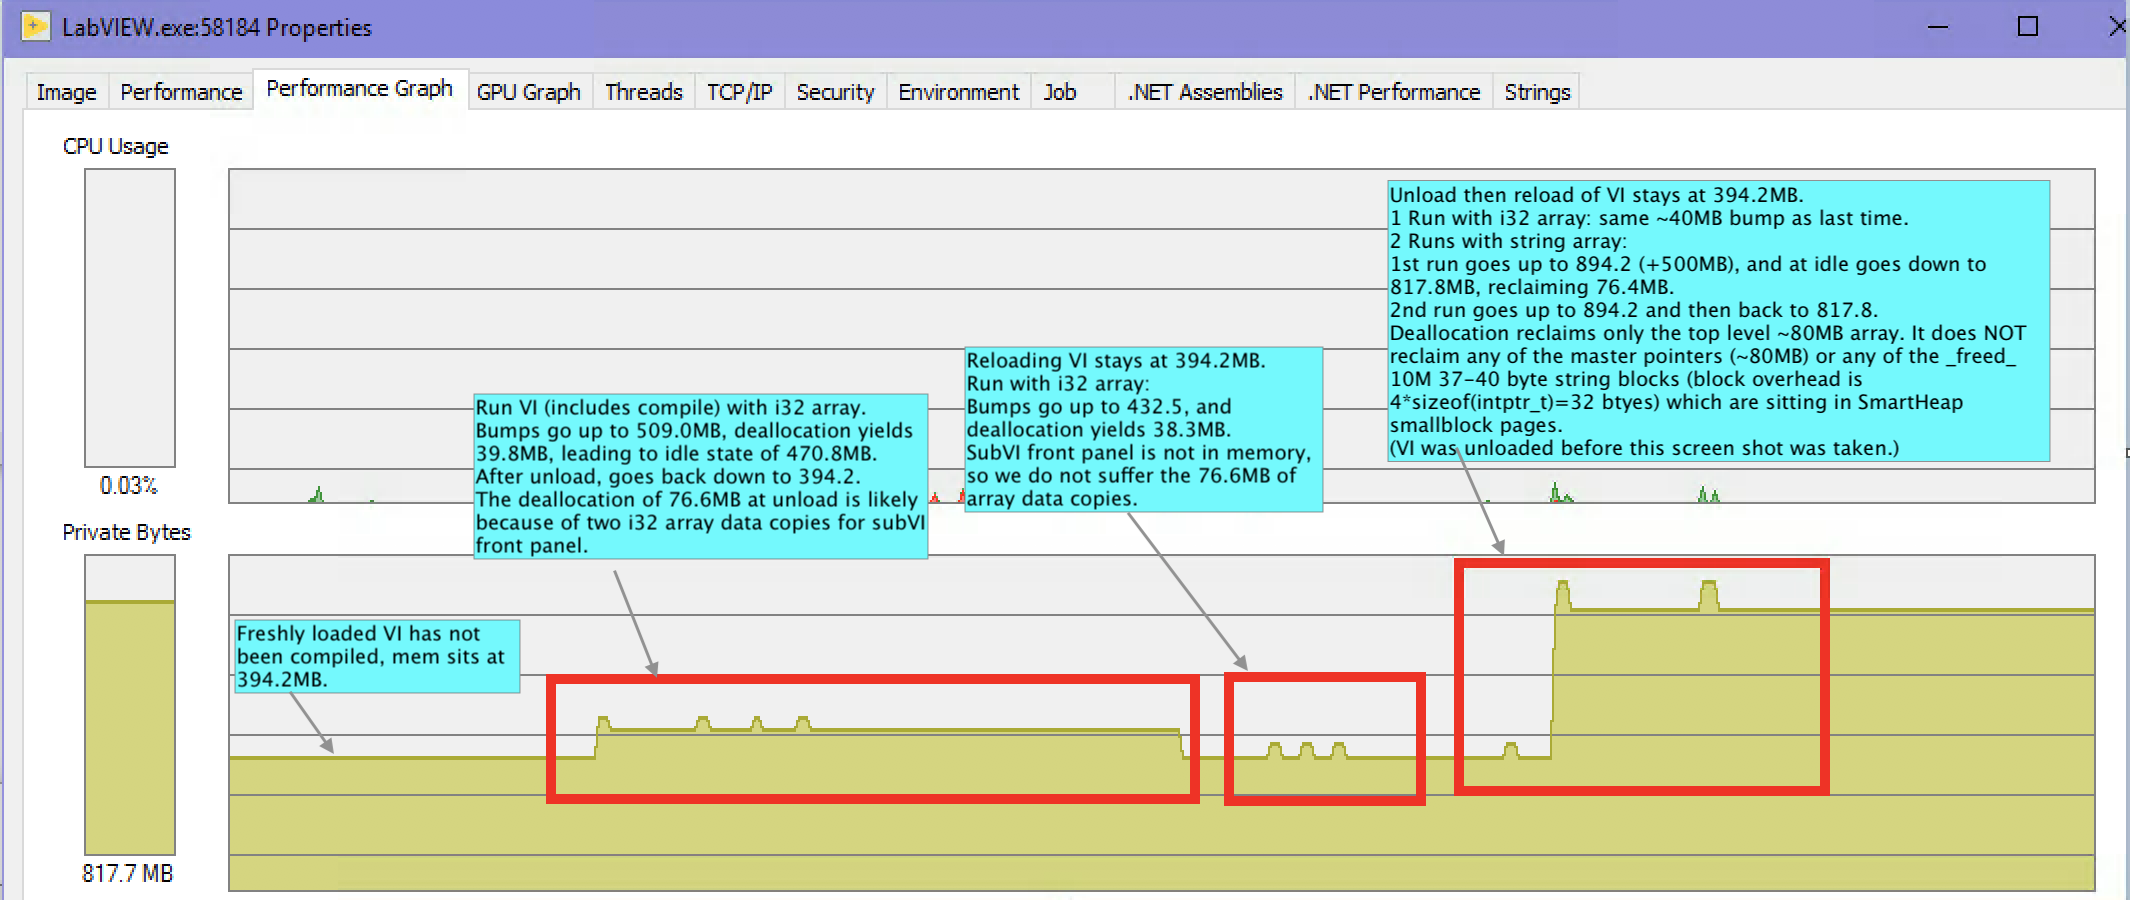
TL;DR: This is NOT a bug. It is all explainable by the normal behavior of the memory management mechanisms used by LabVIEW, including a memory allocator layer provided by SmartHeap (from MicroQuill). Details: Actually the original bug report in Dec 2013 by Mr Mike (bonjour, Mike!) was pretty accurately analyzed and documented by Ryan P in 2014 and the bug was closed then. Mike's post from today did manage to gain the attention of someone else at NI, who asked me to take a look. I reviewed the VIs from this page and decided I could explain all the behavior with actual numbers. See the enclosed picture of Process Explorer's trace of LabVIEW 2019 (64-bit) memory usage during a session looking at these VIs. The labels I've placed in the picture attempt to explain it all, but I'll summarize by saying that all the "lost" memory (around 422MB) can be explained by the 10M master pointers managed by LV, plus 10M _freed_ small blocks sitting in pages managed by SmartHeap. These _freed_ blocks are not "lost". SmartHeap knows where they are and will let us use them again, although because they are small SH keeps them in special low-overhead pools that are used _only_ for small allocations, and who knows when LV will need 10M small blocks again. These _freed_ blocks were formerly the 10M strings with one "space" character in them, each of which actually take up probably 40 or 48 bytes. Each string block has a LV-managed 32 byte header, plus a 4 byte length, plus 1 byte for the "space" char. LV asks Smartheap for this 37 byte block, and they probably give us a 40 (rounded up to multiple of 8?) or 48 (rounded up to multiple of 16?) byte smallblock to contain our request. Small blocks in SH are low overhead because they only require a single bit to represent their inUse state and require no header of their own. The numbers don't all add up exactly, but they are sufficiently in the ballpark that any slop is explainable by the the fact that a lot of other stuff is going on in the memory management arena in LV. It's complicated. There could be significant amounts of fragmented small free blocks already available. Process Explorer could be reporting in mebibytes vs. megabytes. etc. Hope this helps. Rob
 3 points
 -
That's a mighty fine VM you got yourself there. Almost like having a VM of this Linux RT target is a super useful tool, that helps troubleshoot and debug features of the embedded UI that are at times "inconsistent" as you put it. For anyone else that finds this useful you should go vote on the idea, and/or contribute to the conversation.1 point