smarlow
-
Posts
123 -
Joined
-
Last visited
-
Days Won
14
Content Type
Profiles
Forums
Downloads
Gallery
Everything posted by smarlow
-

Set While Loop Timing Without Delay Function?
smarlow replied to Gan Uesli Starling's topic in LabVIEW General
If you are using a DAQ device, it's probably a hardware-timed loop. The loop iteration interval is determined by the amount of time it takes to acquire the data. For example, if you define a DAQmx task to acquire data at 1 kHz sample rate, and acquire 500 samples, the DAQmx read operation will take 500ms. -
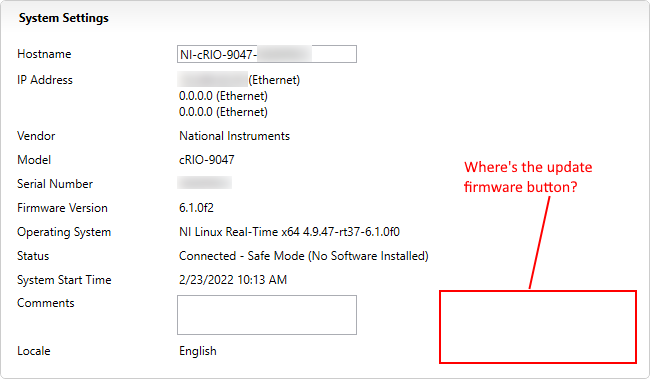
Found the issue. The cRIO and PC were connected via a router which was blocking the port used for firmware updates. NI MAX should display a message where the "Updated Firmware" button should be indicating that the port (with port number) is being blocked.
-
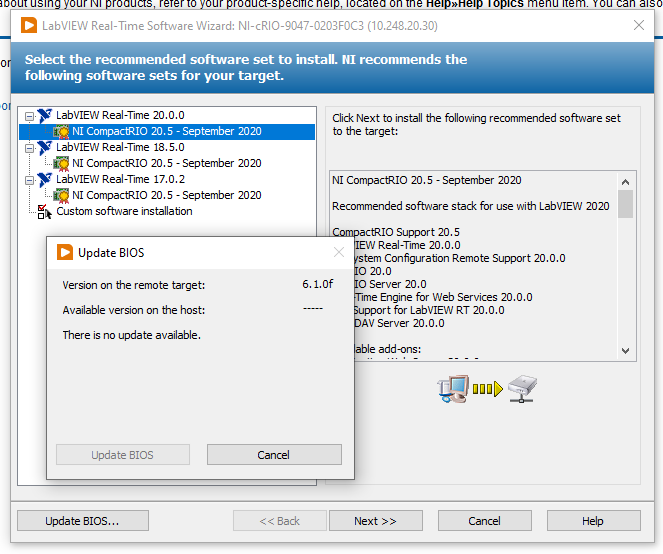
Just got a cRIO-9047 out of the box. I am running LabVIEW 2020 SP1 on the host computer, and the cRIO is running firmware 6.1.0f2 (why so old for a device that just shipped?). We ordered this controller/chassis months ago, but delivery was delayed, supposedly due to the chip shortage. The host computer is running CompactRIO 21.0 drivers. When I try to install the latest software (anything newer than 'legacy'), the installer tells me I need to update the firmware on the controller to version 7 first. However, when I select the device in MAX, the 'Update Firmware' button that is supposed to be on the System Settings tab is missing. I have 4 sbRIOs on the same subnet, and they are all good (Update Firmware button showing, running newer, non-legacy software loads). When I run the legacy installer for 20.5, and try to use the 'Update BIOS' button on the installer dialog box, I get a dialog saying the host has no new firmware load higher than the one installed, even though I am running the latest CompactRIO drivers. Has anyone else had this problem? Without a solution, I can only run the legacy software load. Thanks for any help.

-
LabVIEW, Websockets, and SVG
smarlow replied to smarlow's topic in Remote Control, Monitoring and the Internet
I am still here. It's just by chance that I have reemerged here today. I used to have a bunch of code posted at my old company, but that domain no longer exists. I still have the example code, but most of it is too complicated, and will take a long time to slog through if you're just starting with Javascript/HTML. If you want to do a 'homebrew' approach, I can help you get the websocket link established in LabVIEW. That part is easy. What's not so easy is all the Javascript you have to do on the browser side. You can use an open-source canned script library like https://www.rgraph.net/ to do graphs and dial indicators, etc. You can also use standard HTML5 buttons and slider controls, spin controls, etc. for inputs. Doing that requires you to know how to mix HTML with Javascript. Your other option is to pay $$$ for something like LabSockets, or the LabVIEW NXG web VI option. -
Unfortunately, the Picture Functions VIs are eliminated from the RT palette, so you can't draw a graph if you wanted to. What you could do is to draw a graph in Inkscape as an SVG file (which is just XML), with the plot as a multi-point line and replace the points in the plot line with scaled data points using the XML editing functions. I can walk you through the process if you want, since I used to develop WebPanel (now defunct) a long time ago. See webpanel here
-
You are correct that an RT target alone cannot execute the Get Image invoke node. Interestingly, it will execute if you are running the VI on the RT target from the host LabVIEW IDE. The Get Image node actually runs on the host computer (even though it is on the diagram of the VI "running" on the RT target) and sends the resulting data to the RT target. As soon as you compile the RT VI and try to run it alone on the target, it will not run. This must be that because in order to see a "front panel" of a VI running on an RT target, the FP operations must be transferred to and executed on the host.
-
Check out the UDOO embedded PC's. They run Windows or Linux, and the new model has Ryzen CPU. You should be able to run LabVIEW runtime on these (although I have not tried it on this device, I have run LV runtime on Atom quad core before) https://www.udoo.org/
-
Event structure and case structure in the same loop
smarlow replied to takanoha's topic in LabVIEW General
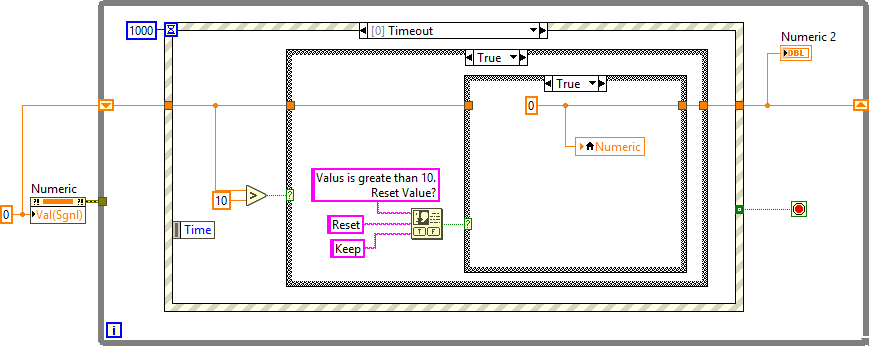
You will notice in my example above that once the value exceeds 10, it is hard if not impossible to change the value again due to the one-button modal dialog box. You can eliminate this problem by using a two-button dialog and giving the user the opportunity to reset the value using a Value Signal property node, as shown below: Or, if you prefer, you can use the case structures and a local to reset test.vi
-
Event structure and case structure in the same loop
smarlow replied to takanoha's topic in LabVIEW General
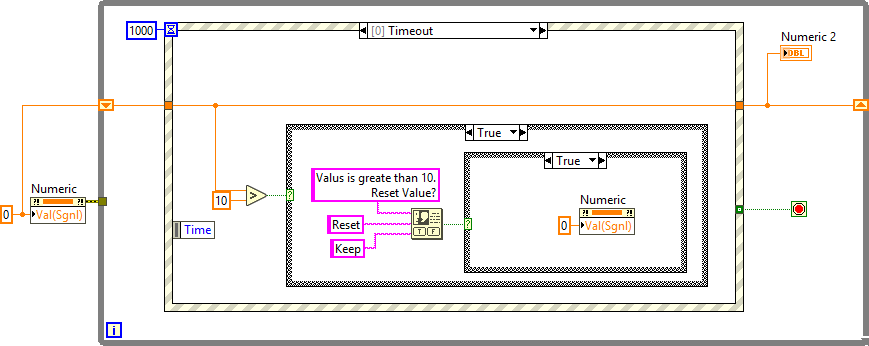
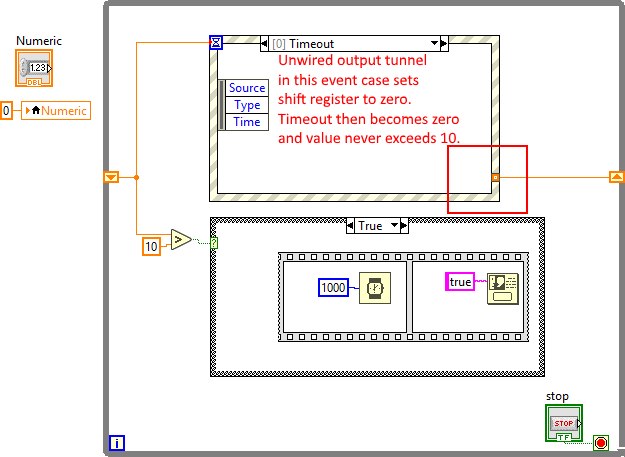
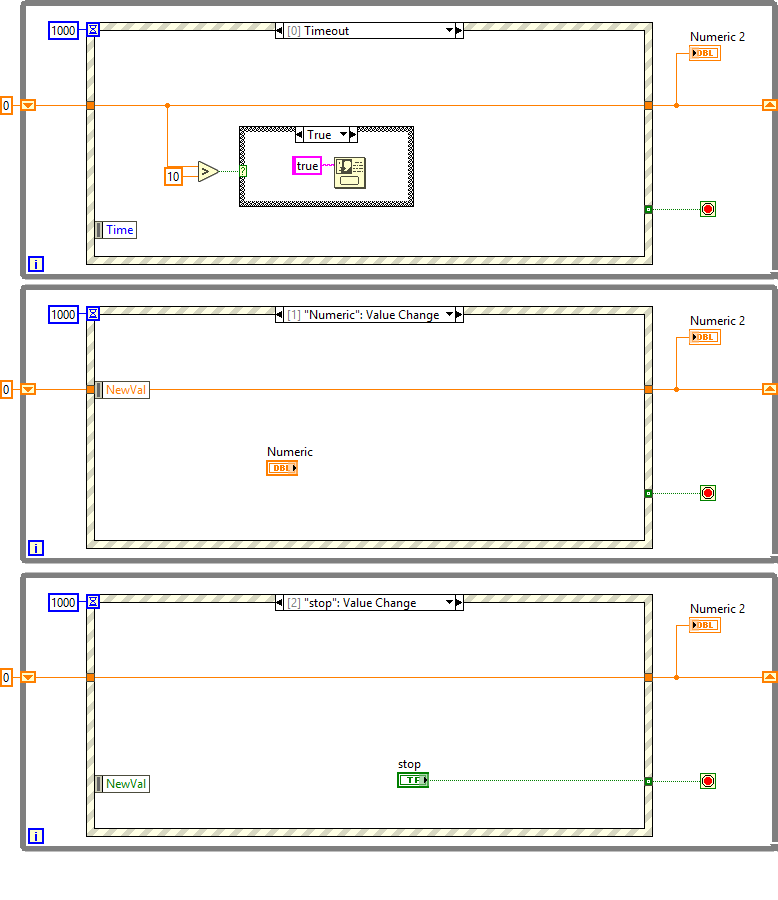
Looking at your original code, your timeout case had an output tunnel that was unwired. As soon as your timeout case executed once, the timeout value would go to 0 and the sift register value would get stuck there. If you set the timeout value to zero, you program will get locked in the timeout state. Why did you wire the shift register value to the timeout input? Anyway, if the shift register value is zero, the case structure will not execute. There are also a lot of bad habits in your code. You don't need the property node in the Numeric value change event, as it just writes the same value back to the control. If you want to pop up a dialog every second if the value is greater than 10, then use the timing feature of the event structure to check the value in the timeout case. See below for some simpler versions, and an explanation of your error. What you want to do is to use the timeout feature of the event structure to check your value every second and display a dialog if the value is greater than 10. Although I don't really recommend this type of structure, because the modal one-button dialog can easily block the user from pressing the stop button for rates faster than 1000 ms. In this particular case, 1000 ms is long enough for the user to press the stop button. For faster rates, it is not recommended. The Numeric value change event updates the shift register, and the timeout event passes the shift register value through so that it does not change until Numeric changes. I also moved the Numeric 2 indicator outside the event structure so you can see what the shift register value is. If you had done this you would have noticed that your value was getting set to 0 by the unwired tunnel in your timeout case. I also added a stop button value change to stop the loop when the stop button is clicked.test.vi test.vi
-
If you put all the VI's into a library (.lvlib), you can edit the library icon and it will be applied to all the files in the library as a layer. Most people use this to create a common "top banner" for their VI set. The lvlib icon is overlaid as a layer on the individual VI's icons without disturbing changing or disturbing the other layers. I assume that what you are trying to do is add some icon feature to a set of VI's that identifies them as being part of a set.
-
The absence of a thermistor module has been a huge hole in the C-Series modules since they were first introduced. I have wanted to know what the deal is with that since the first time I needed to read a thermistor with cRIO about 13 years ago.
-
Is this what you are looking for?
-
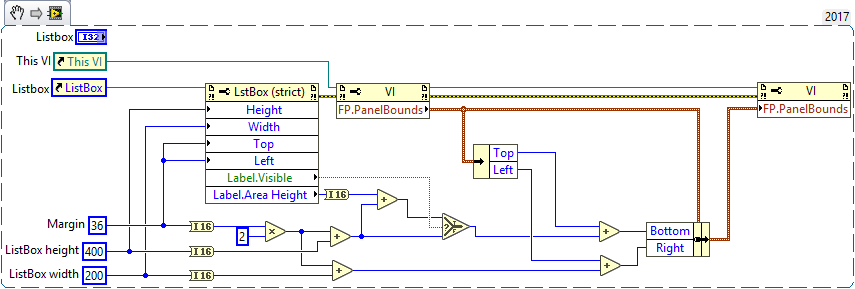
Can you post some code? Are you resizing the listbox using a control ref? is this a "floating listbox" VI? You should be able take the dimensions you are using to resize the listbox, add a margin, and then set the VI front panel to the new dimensions with the margin added on.
-
It sounds like you want to store a binary string to a file and then open it and see the hexadecimal values for the bytes. Notepad only displays file contents as ASCII characters, so you cannot see the actual byte values, only the ASCII characters that correspond to the byte values (the "junk characters" you are seeing). Can't you just use LabVIEW to view the contents of the binary file? Read the bytes into a string indicator and set the display mode to "Hex Display".
-
SVN with TortoiseSVN clent.
-
I still remember the "LabVIEW Everywhere!" marketing campaign of 2004. The IOT realm was going to be ruled by LabVIEW, and soon we would use it to program toasters. Then the embedded module went the way of the dodo, and now it is everywhere except there, and there, and over there, of course.
-
I must be getting old and out of the loop, since I had never even heard of Node Red. Looking at some of the videos on youtube, it looks to be pretty handy, and should make NI nervous. Raspberry Pi Node-RED Tutorial with Modbus & MQTT
-
I'd like to know what the long-term plans are, as well. Watching the keynote addresses via streaming didn't give me any comfort. I kept hearing phrases like "as you migrate", and "when you migrate" rather than "if" you migrate. I have heard timelines for the dual release from "at least a few years" to "maybe a decade". While I am excited about improvements to the environment like integrated hardware interface testing (without programming), the properties pane that is always visible, and the vastly improved palette behavior (heck, I even kinda like the LEGO graphics), I am extremely concerned about the migration to Windows Presentation Foundation (WPF) for the whole environment. I was hoping for something cross-platform and open, so there could be big improvements to Linux and Mac support. NI is putting a lot of effort into fully implementing their driver support for Linux for real-time sake, so it makes no sense they would throw all of their UI eggs into the Microsoft basket. I would have thought they had learned their lesson with the WebUI Silverlight fiasco. I was hoping for full-blown Linux support since with the advent of Win 10 privacy issues, I am trying to wean myself off of MS. They have put a lot of effort into Python compatibility recently, seemingly an acceptance of the inevitable rise of the Python programmer. It's as if they aren't even trying to win anyone over anymore. It's sad, really.
-
It's definitely LabVIEW. As far as SCC is concerned, I use TortoiseSVN and TortoiseGIT shell environments, so a new version of LabVIEW does not affect that.
-
As I was saying in the previous post, there are definitely many things to be thankful for. I for one like the fact that the palettes now dock in the tabbed environment, and they are much easier to use. The palettes slide out neatly and stay out until you left-click on the diagram on empty space. They also provide a back-track trail as they slide out. They are much more usable than they were, even though they have been rearranged. Having the cluster bundle/unbundle and "by name" functions be replaced by a property node is jarring, but it makes a lot of sense if you think about it long enough. It just takes getting used to, like the complete graphics face lift. I can definitely see how a new user will fare much better learning NXG than the current LabVIEW. The old geezers like me will adapt as we always have, albeit with a lot of yelling at the cloud.
-
I have heard they plan to have both versions available for a while, but have not heard just exactly how long that "while" is going to be. They also unveiled the beta version 2.0 of NXG is available for downloading. I have not downloaded it. One of the concerns I have over the possibility of being herded into NXG is it's based on the Windows Presentation Foundation (WPF), and so is a Windows-only program, there is no Mac or Linux version, and probably never will be. I had hoped we would see more support for Linux desktop rather than less, since they are making a real effort to build out the instrument and DAQ hardware drivers on the Linux platform due to their transition to Linux RT. A new face-lift for LabVIEW that is cross-platform (Qt, maybe?), and official support for Debian distros like Unbuntu and Mint would have been a much more welcome sight. With that said, there are soem welcome and long overdue features in NXG, such as the tabbed window environment that should have been present in regular LabVIEW a long time ago.
-
I just downloaded and installed LabVIEW NXG. At first I thought I installed LEGO NXT by mistake... All kidding aside, I am just now poking around to see what is there, and there are definitely some things to be thankful for. Other things...not so much. Extremely radical changes to the graphics on the palettes and root functions, along with major palette restructuring. Looks like navigation by sight will have to be learned all over again. I will post more thoughts on this thread when I get the chance. Oh, and manual tool selection is gone, along with the tools palette, if I am not mistaken.
-
Yes, I can see you've done quite a nice job with the front end, and it looks very flexible. After I posted, I had some additional thoughts about what you were trying to do. It was just hard to see where you were going from your original post. Actually, your final solution looks good.
-
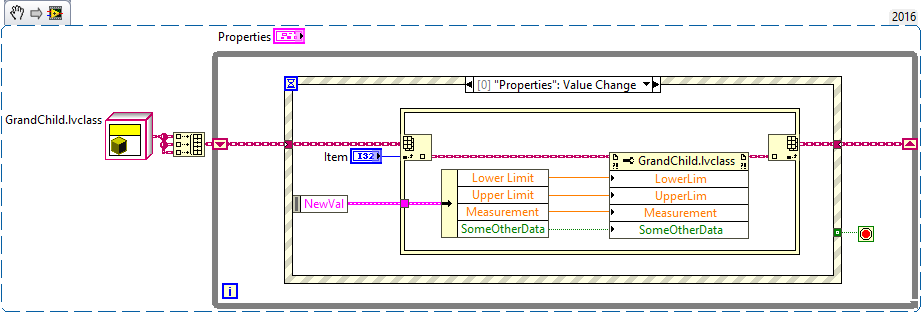
After looking at your code, I can see what it is you are trying to do. It looks like an attempt at the old "Magic Framework of Massive Reusability". It's a nice to think you'll have to build this only once and then reuse it everywhere. You'll have these convenient VI's that automatically launch at all three class levels that allow updating the data at their level for all the objects in your array. The question new LVOOP or even just new LabVIEW programmers usually ask is something close to: "Why do I seem to keep building the same program over and over again?" and/or "Isn't there some way I can build some magic modular framework once and use it everywhere?" Many have tried, including the Actor framework. Some of the newer ones work well, but all are messy at the bottom, in my opinion. Even if you were to get this hierarchy to work, how convenient would it be to use, really? Everywhere it goes, it will need three sub panels. My advice would be to forget the "ModifyUI" method for your classes and take a traditional approach of putting the controls for modifying your class data all at the same level on your main front panel. You'll suffer some aggravation at having to build that top-level VI over and over again, but your programming style will be easy to understand and debug. Keeping it simple is usually the best approach.
-
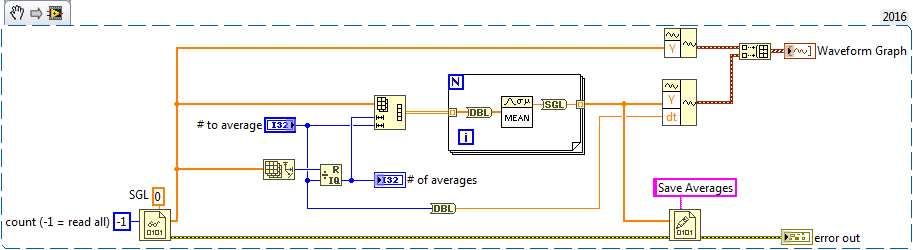
There are lots of different ways to process the data in an array this way. One way is to reshape the data in the file, which is a 1D array of points, to a 2D array. The rows of the 2D array is auto-indexed using a FOR loop, and the points in each row averaged together, as show in the snippet I have attached. This code places the original points, and the averaged data into Waveform data for comparison in a waveform graph. I read your data in and it looks to be SGL data points. I also noticed that averaging 50 points severely degrades the features of your data, so you might want to use a smaller number. This code writes the averaged data back to a binary file that is the same type as the input. Also, if the number of points to average is not an even divisor of the number of points in the set, the data is truncated. Hope this helps.