

Michael Aivaliotis
-
Posts
6,217 -
Joined
-
Last visited
-
Days Won
120
Content Type
Profiles
Forums
Downloads
Gallery
Posts posted by Michael Aivaliotis
-
-
No, S-parameters are NOT patented, I was talking about the calibration algorithms. As far as LabVIEW's capabilities, I have yet to find any limitations. Even in the RF\Microwave field. Are you using any automation at the moment? If so, what software are you using?
Another thing to look at is NI's add-on RF Software tools for your industry.
Perhaps if you explain what specific problem you are trying to solve then I can guide in the right direction.
-
Well, since you asked...
When the person is placed in the box, her head sticks out one end and her feet stick out the other. The magician then spins the box, and when the feet are pointed away from the audience the assistant retracts her real feet and replaces them with a pair of fake feet. The lady is a contortionist, so she folds her legs into the upper part of the box and the magician "saws her in half." Because we saw the lady stick her feet through the holes, we assume they must be her feet the entire time, and the illusion is completely baffling!
-
Chilly Charly, wow, I had to do a whole multi-media presentation to get you to finaly post something to the Forums.
 Whew, that was a lot of work, but I finally got Chilly Charly to join us over here at LAVA.
-
The smith chart is a typical display function for s and t parameter arrays, but it does not imply any specific format for representing logical groups of s parameters such as the typical multiport s parameters, it just displays complex arrays. I already measure, read in, and manipulate large groups of s parameters from Network Analyzers although up until now these are mearly a collection of arrays, in some cases multidimensional arrays that are formed in an s parameter layout.
The newer analyzers like the Agilent E5071B naturally operate on multiport s parameters and t parameters, so I started looking into how Labview would represent such data, and was surprized to find nothing. It is clear that direct matrix multiplication and the other matrix operations can be used on 2 dimensional complex arrays, thus implying the correct form for a multiport s parameter data structure, however Labview has no support for typical things like impedance transformation and t parameter conversion.
They certainly have quite a few complex matrix math functions, but I was very surprised to see that it (at least Labview 6i) is virtually mute on the whole issue of s parameters. I don't mind cooking my own, but I think it is always better to work as a community. I was also surprised to find nothing about this in LAVA.

I misunderstood. I thought you were interested in the display aspects of S-par values. This is why the post was moved to the user interface forum. Perhaps another move is necessary.

In any case, I assume you've seen the complex palette?

PJM always calls me a master of the obvious but I'm always surprised by how many people miss this palette.
No, LabVIEW does not have functions to operate on multiport S-parameters. On the other hand, why should it? Are you trying to perform correction on the measurements based on calibration data taken for the multiple ports? To do this you need to apply the formulas required based on your calibration method. Most of these correction formulas are public knowledge and can be easily implemented using basic math primitives. All the primitives (+,-,/,etc) work natively on complex numbers so no special transformation is required.
Some calibration methodologies are patented and can only be used after paying royalties to third parties, however those are not always necessary. BTW, are you doing a full 12-term 2 port calibration on the analyzer ports? I assume you are using some sort of switch matrix to automate the calibration and measurement process, right?
-
I started looking for program examples of how best to represent multiport s-parameters and t-parameters in Labview and was surprised to find only the definitions in the NI dictionary. I expected to at least see some common 2-port s-parameter programs, but couldn't even find any of these. Is no one doing any of this, or maybe I'm just using outdated terminology?
:headbang:
Are you talking graph displays like Smith Plots? Look under the Graph palette.
-
Damn! my secret has been revealed. PJM, you know better than to reveal a magicians secrets. If you're told how the lady is cut in half, it's not so exciting.
Yes, well, a few years ago and with lot's of experimentation time on my hands, I discovered the secret to cool panel behaviors. The Window Size settings in the VI properties that allow you to scale all objects as the window resizes is CRAP. Don't ever use that, you will only end up with distorted overlapping front panel controls everytime you resize your panel.
The key to the fancy autosizing panel stuff is using the Scale Object with Panel option from the Edit menu. Actually this setting has been there since LV5.1 but few people ever use it. Perhaps because nobody ever explained its usage.
You can only use this setting for one object at a time. However this is enough for most situations. The key is to focus attention on one central object that is important to you. In the case of Commander, It's the multicolumn listbox. In your case it may be a text box or even more exciting: a picture control.
You will notice that once it's enabled, the object will always size towards the bottom and to the right. This means you need to anchor your panel to the topleft origin. This can be easily done with a property node upon startup. This isn't critical but will make editing easier. Also, make sure to limit the minimum size of your panel. This will give you a stable size from where your panel can grow. When you edit the panel you should save it to this minimum size so all future edits start from this reference.
Once this basic setting is defined and you central resizable object is set, you can then go crazy with the surrounding buttons and other objects. The trick to using that is knowing how the scalable oobject affects its surroundings. The objects stretch and move along with the resizable object. Here's a video that shows how 3 buttons re-position themselves as the panel resizes, very annoying eh?
You need to group all the buttons together but that is not enough. You must anchor them to the left or to the right of the resizable object by grouping them with a dummy object. This can be done with a decoration as shown in the video below (zipped for size):
As you can see, this can now be a powerfull tool once you understand the behavior of the resizable object and how the surrounding objects relate to it. If you want to elaborate on the above technique you can group some objects to the left and some to the right depending on how you want things to move related to your central object. Another good idea is to lock your central resizable object to your panel because this will prevent it from sliding around.
-
Are you saying that after you do a write to flash, you will lose that data if you do any file IO before the write timer expires? This is odd.
-
-
-
Thanks for your answer, this will work i am sure.
My concern is if the data block is large (10 Mbyte onwards), that the overhead will be time consuming ?
It's difficult to imagine what the data conversion is adding (my previous saving in Ascii format cost a lot time converting from double -> Ascii and from Ascii -> double in Matlab and i lost resolution)....?
I don't see a lot of problem with overhead. Are you saving all the data at one time? Perhaps you want to change to saving line by line if using ASCII. The input to you VI can be variant, but the file save format can be something else. If you're saving as an ASCII then you will be limited to the resolution of the precision you picked in your format to string function. I would recommend using exponential notation in addition to high precision. This way you get the highest precision for the units you are using. Also, what is a MATLAB format?
-
If want to throw another app on your already application drenched computer... Here you go:
-
Oh god, if only I could post the diagram of some code I had to review and evaluate lately. It made me want to take a hammer to my laptop (it's a very nice laptop, btw). The chaotic mess was burned into my retina. I had to watch Britney Spears videos for hours just to wipe away the images from my brain. I thought to myself, God almighty! Is it really possible that there are such bad LV programmers out there?
Picture this... Suppose someone asked you to write LV program, and the only way you could pass data around was via the "value" property and using ctrl references. Now you get the picture.
So when you say you can easily figure out LV code quicker than C code, think again. You'd be surprised.
-
The right kind of man asks the right kind of questions :thumbup:
1) DAQ & GPIB mainly NI. Vector network analyzer, power meter and sweep synthesizers are mainly HP. Source meters & switch box mainly Keithly.
2) Post processing imported from network analyzer or DAQ to further processed in PC, typical parameters in data sheet such as IP3, noise figure etc
3) The most common task we encounter is device characterization and it covers broad spectrum of ICs. The test operators have minimum knowledge of everything, except push the button, or click the mouse to be exact.
4) We have few software engineers in house and are strongly C & C++ oriented. I have 20 plus years in C programming and assembly language, in embedded system, test and measurement lately. Since I am also the hardware guy, if the load is too much to for me to handle, subcontract is also another option.
My concern is this: ease in programming with relative low learning curve and the ability to adapt to 3rd party developer, especially in DSP areas and RF which have intensive mathlab applications. Consider our background, it's a natural tendency to lean toward LabWindows but Josep Travis's ATE implementation in Labview just piques my curiosity.
Yes, this is good. Just to be blunt about it, I would recommend LabWindows. I've developed my own test executive to handle various RF measurements in LV and it wasn't easy. I only manged it because I had 10 years of LV and RF testing experience under my belt. BTW, RF formulas don't translate well to LV primitives. The nice thing though is that all the LV primitives work on complex numbers. They're polymorphic that way. I even managed to build a full 12-term 2port calibration routine in pure G.
In any case, it sounds like C is your forte so stick with it. With LabWindows, you get the nice compatibility with the NI hardware, the many GPIB IVI drivers and the user interface tools which give you graphs and other instrumentation type goodies. Have you considered test-stand? It will help get you started on the test executive which you won't have to build from scratch.
The only bad thing about going with LabWindows is we won't get to see you on the forums.
-
Hi all,
Sometimes I have this annoying bug concerning the scrollbars of elements. See attachment, the vertical scrollbar has a black line with what looks like arrow heads or something.
I found this problem with all sorts of controls, tables, IMAQ-indicators and so on.
Does anybody know how to fix this??
Greetings,
VDB

Wow, this is one for the record books. Strange. Try turning video acceleration OFF in your video driver.
-
Hi,
I have the multiple Analog Output circuit as you can see in the picture. The strange thing about is that I have around every 2 sec a cpu usage of 99%. The paradoxically thing is that the system thread uses that and not labview. But as soon as I stop the vi the cpu usage is 0%. And that doesn't happen with other VI's running, so it seems to be a problem of my programming.
But what's the problem ??
I also tried other VI's with Analog Output. No problem.
I don't really see the connection between the displayed code and the 99% CPU usage every 2 seconds. What else is happening in this VI? I notice you are using Matlab somewhere. Is it in this VI?
-
Hello,
I was wondering whether it is possible to allow the icon in the upper-right hand corner of LV to be displayed in windows prior to opening. I already have an icon designed for my program and it would draw the user's attention much faster if it were visible prior to running. Any help on this would be much appreciated.
Why not just create a shortcut the VI you want the user to run? Shortcuts in Windows can be assigned any icon you wish. If you play with the basic icon defaults of ALL vi's in your system then this can get confusing since ALL VI's will show this new icon. Not a good thing to do. This is the primary use-case for shortcuts. To create custom icons for launching specific files.
-
I need to click on a dialog put up by Excel when I re-write a spreadsheet file with the values of some cells changed. The approach I'm taking is to place the mouse at the
-
Here's a post from another LAVA member that makes a call to a website to do a spell check. Not your ideal solution but can give you an idea. All you really need is a good word list, then do a match pattern and word length check, right? Not totaly trivial but doable nonetheless.
http://forums.lavausergroup.org/index.php?...findpost&p=1292
-
beside the obvious that one is a graphical language and other is text based. We need to build a test scheme to test RF components for military and space industry, in addition to mixed-signals ICs. What would be the ideal platform to do the job described above? Why would NI build 2 products when one can do the job so it must be something in it to differentiate the 2 products, right? TIA.
I'd love to answer this question intelligently but I don't think you've given me enough information. Yes, one is text based and the other is graphical. You state the following: We need to build a test scheme to test RF components for military and space industry, in addition to mixed-signals ICs. I've done that using LabVIEW. I've also done dozens of other applications in various industries, So? What hardware will you be using? NI or another vendor? Do you or any of your employees have programming experience? In what language? Do you have software engineers in-house or will you subcontract out?
The main reason for the LabWindows product is to tap into the C programmer market. Those hard-core developers that refuse to use LabVIEW but are fluent in text-based programming.
-
-
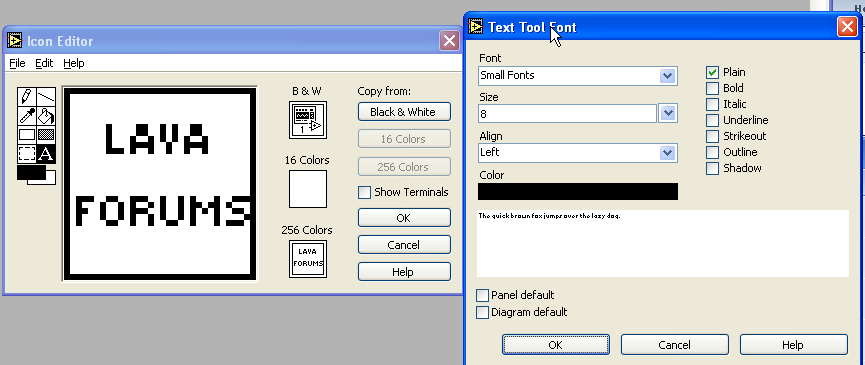
Well, speaking of Icon editing: If you pick the font called: SMALL FONTS and use CAPS with size 8 then this looks great in the icon regardless of what you type.

-
Ok, just set the record straight. OPC communication is just fine with Datasocket. I've done it and worked with it on about 200 tags.
Also, OPC servers are a dime a dozen. Pretty much any OPC server you can think of will work with LabVIEW. The job of the OPC server is to provide a constant communication path to the hardware. It is responsible for hardware communications and protocol management. So, the most important question for you in an OPC server is: Does it communicate with the hardware you are using? LabVIEW is ignorant to this.
OK, so the next question is: what's the deal with DSC module? The deal is that everytime you open a Datasocket tag connection to the OPC server, it opens up a new communication pipe between LabVIEW and the OPC server. 200 tags mean 200 connections. The DSC module opens up 1 sigle communication pipe to the OPC server regardless of how many tags you are reading. This can significantly speed up the update rate of your tags. This is not the only feature. DSC gives you automatic dataloging plus there are smarts like updating values only they're changed etc. One thing to note, Datasocket is free. You can easily try this theory right now (if you have the hardware).
I've worked with both and can comment more, however one important lesson I learned is that you should try to get the fastest IO pipe you can get. For example, if you have a choice between serial or ethernet, choose ethernet. Whatever's the fastest option with your hardware. The money spent is worth it for the response you will see and feel.
-
Also, see this FAQ entry:
-
It works for me in Winamp. I'm not sure what problems you're having. In case it gets lost in the future i'm attaching it here.
 And NI is too cheap to pay those royaltys?


Arithmetic is different in formula nodes
in LabVIEW Bugs
Posted
This is a bug. Originaly (pre-LV6i), the formula node used ^ for exponent. I think in LabVIEW 6i they changed the exponent to ** for the formula node. They forgot to change the Eval node. See attached image of the formula node online help for LabVIEW 51 showing the exponent notation used.