

Michael Aivaliotis
-
Posts
6,217 -
Joined
-
Last visited
-
Days Won
120
Content Type
Profiles
Forums
Downloads
Gallery
Posts posted by Michael Aivaliotis
-
-
This does not seem to be a problem in the "classic" version of the table. I assume you are using the default 3D one. This is probably a bug but there is a workaround that "unlocks" the colour picking on the background. See the attached AVI that shows the solution. Download File:post-2-1126592671.zip
As you can see, the background colour selection "unlocks" once you hover over the first (far left) user defined colour.
-
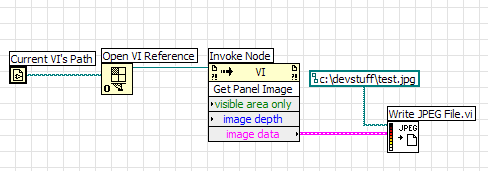
Khalid, this is correct however it appears Fernandotid has LV61 so the solution is slightly different since that method changed in LV70. Also, there is a method that operates ONLY on the ctrl of interest. No need to capture the entire panel, only the graph. Find an image attached of how to do this in 61.
PS. Fernandotid, considering the Forums just saved you $495,
 why not donate some of your new found wealth to LAVA?
 -
-
Vektrex has a good list of useful shortcuts & tips.
Hmm, this is a neat trick from that site:
Look at the Analog Output of a DAQ E Series card without manually wiring it back into Analog In line by using channel 21230. -
-
Coding Challenge
Ok, LAVA Members
 You think you've got what it takes? Do you want to own a very desirable Grey LAVA T-shirt and White Mug?


All you need to do is participate and win our first official LAVA coding challenge.
Challenge Description:
Model the ripple effects of moving a mouse over a liquid.
Download the following AVI movie to view an example of the challenge.
Download File:post-2-1126486112.zip
The minimum requirement is that your mouse disturbs the background image when hovered over it. The disturbance must be as close as possible to that of a liquid (ripples). The size of the image must be 500px wide by 200px height. You may use IMAQ tools and viewers, however the goal is to accomplish this challenge using the default picture control that comes with LabVIEW. If you know of a better native way to do this in LabVIEW, go right a head.
For bonus points you can implement the following features:
- Ability to load any user defined image (jpg or gif).
- Hovering the mouse over the image produces a light ripple effect. Click and drag the mouse produces a more pronounced ripple effect (waves).
- The liquid density can be configurable.
- Include random droplets of rain.
- Include wind effects.
- Include falling leaves.
The toplevel VI submited must be named Making_Waves.vi and can be stored in an llb file if desired. The use of sub-vi's is allowed. Please include them all. Scores for this competition will be based first and foremost on the functionality of your model and realism. They will also be based upon coding style. For help with coding style, see Chapter 6 of the LabVIEW Development Guidelines attached: Download File:post-2-1126488648.pdf
Note:
- All coding must be done in LabVIEW.
- No external code, DLLs, CINs, exes, ActiveX, .NET, etc (DLL's or libraries that are part of the core LV are allowed)
- Have fun!
Submit all solutions to: codingchallenge@lavausergroup.org. Do not post them to this thread. The deadline is Nov. 30th 2005. You can use this existing thread to discuss the challenge or to ask questions.
Good luck!
PS. The winner will have the choice of showing a special icon next to their name on the Forums. They will also have a special signature image. The details of these images will be revealed soon.
- Ability to load any user defined image (jpg or gif).
-
True, but this works too (see attachment) You where playing with the wrong end of the drag'n
(The tails bad but the heads even worse)
You can ignore undefined Mouse Up events, just clear undefined Mouse Down events.
Control Mouse-Down's take priority over the vi Mouse-Down.
So your orignial, simpler idea was almost right.
-Bill
Your solution is very nice. This is why I love the LAVA Forums... Great exchange of ideas. Keep it up guys... and gals.
-
Too many colours: Bad.
Default OS attributes + colors: Good.
Icons on buttons with text: Good.
BTW, Irene, To reduce the amount of work, reduce the colors. Use the OS attribute. This way if they don't like the colors then let them change the OS colors which in turn will automatically change your panel colors.
PS. Color=US, Colour=Canadian\British.
-
Very Nice! Now if only it would remove transparency when I hovered over it with the mouse and then return transparency when I remove the mouse. I would program it myself but I think the Mouse Enter event is only available in 7.1. Hmm, you could possibly create a timeout event and monitor if the mouse enters one of the dial controls.
-
Yes, picture as intended... But I am not a closet user since I don't actually use them.
-
Related topic/poll:
What is your Desktop Icon and Shortcut philosiphy?
A)Hate them, need a clean screen to think.
B)Make nice logical Groups.
C)Try to beat them back to one row per edge.
D)Spring clean when the picture is hard to makeout.
E)I love my icons! I just make 'em, I can't bring myself to kill one.
F)other_____________
-Bill
Icons on desktop are bad form in my opinion.
I hide them all, How can you find anything like that? Very messy and useless. How many applications do you really use on a daily basis? Put those in the root of your start menu. It's hard to think clearly and you can easily click on them by accident when programming. I like a clean slate. No need to delete them, just turn them off globaly:

-
The panel resize event is tricky tu use. Tens or hundreds of events are fired while the user resizes the panel. If you make something that forces the panel to redraw, it is funny to see the panel keeping redrawing well after the user has left the mouse until all events are serviced. You have to catch when the mouse button up but since the handle to resize the panel is "outside" the panel, it does not fire a mouse button event in the event structure. You have to use the mouse device functions to detect the mouse button up.
Indeed, this feature is a blessing...
Yes, your solution is good. Here is another one which is easier to implement and actually works quite nice. BTW, this is also used somewhere in Commander I think:
-
That's not entirely accurate. You can use the VI class method Fake Exec State to trick LV into thinking that the VI is idle (state 2), but you should be aware that many features will either stop your VI, cause it to crash or cause LV itself to crash, because modifying LV code while the VI is running is almost a sure way to do that.
OOH nice one,
 I gotta try me some of that!
 -
There are some "States" in my current project where I'd like the code to process as quickly as possible. (Re-sizing and saving images) But I notice poor front panel performance (lagging mouse and keyboard etc.) when there is no "Wait" function in my main loop.
My question is; Am I asking for trouble by doing this? Is there a better way?
Thanks.
My customer's look at me strange when I tell them: "I improved the performance of the software by adding a delay". This technique is perfectly fine.
-
Here's the modified example to address the concerns about unregistering the mouse down if clicked outside the indicator.
-
Michael,
Your solution is probably the best one for dragging the content from the control to the indicator :thumbup: but, in his original post, Simon said:
and your solution does not do that. :thumbdown: The approach he posted to Info-LabVIEW:
, while too sketchy to be definitive, certainly has the potential to do so.
Where is your improved solution then? Read my signature...
-
As I understand it, you want to call the same VI twice. In one case you want the front panel to open and in the other case you do NOT want the front panel to open. Well, there are two ways to do this.
One way is to setup the subvi node to behave differently for each call on the diagram. You right-click on the VI and select "sub-vi node setup". This will allow you to define how the VI will behave for that call and only that call of the VI. See images below:

The other way is to place a property node inside the sub-vi that controls the behavior. Then you can feed in a control wire that activates the proper behavior. The default behavior would be not to show the panel unless the boolean is set TRUE.
-
A question on Info-LV prompted me to answer with an example here on the Forums:
Dear all,I'm trying to write a VI that implements simple drag and drop using event handlers.
This is a proof-of-concept thing at the moment, so it's practically useless, but bear with me...
I have two text controls and one text indicator. I want to be able to click on a control and drag the mouse over to the indicator - when I let go of the mouse button the contents of the control I dragged from are copied to the indicator.
I can get so far by using a Mouse Down event on each control, in which a ref to that control is written to a shift register. In the Mouse Up event on the indicator, I check whether the contents of the shift register represent a valid text control. If so, I copy the value of that control to the indicator. So far so good.
But - I want the VI to clear the reference if I drop anywhere other than in the indicator. I've tried adding a "<This VI>.Mouse Up" event, but this event always takes precedence over the indicator's Mouse Up event. I thought I might be able to get around this by re-ordering my events, but that makes no difference.
Any clues on how I might proceed? I imagine that dynamic event registration might hold the key, but as far as I can see I'd need to be able to dynamically register an event to handle either Mouse Up on the indicator or Mouse Up on the VI (with registration occuring on Mouse Over and Mouse Out events on the indicator) - but I'm not having much joy there because the VI and the indicator are different types.
Thanks in advance,
Simon
Here is a VI example (LV7.1) that acomplishes this. You need to register the Mouse Up event dynamically on the indicator that will receive the drop:
-
I should also mention that I have 2 objects I would like to be resizable. I grouped the 2 together before setting it as resizable. Would this be the cause for the behavior I'm seeing?
This can't be done. The resize object only works for a single object. Grouping them doesn't work... sorry.
Well, the instructions mentioned give you some capabilities with zero programming. Of course if you tap into the panel resize event and want to do some programming then you can do whatever you want. Anything is possible in LabVIEW once you use this event.
-
-
This will not help you. The Eval Formula VI works at run-time allowing formula parsing and evaluation. The Scripting VI indicated above is a development tool that creates a formula node during edit time. Here is a picture of the code so you can create it yourself in 6.1

-
Oh no. Please don't use global variables of ctrl references. If you absolutely must store the reference somewhere, use a functional global (while loop with shift register). Also, I'm NOT a proponent of writing directly to front panel controls from one VI to another because it makes code unnecessarily obfuscated. When debugging problems, it's hard to know what is coming from where.
-
Sometime when I open some VIs for the first time a dialog box saying "Cannot find the file'//opened.vi'(or one of its components). Make sure the path and file name are correct and that all required libraries are available." is displayed. But still the VI opens and runs without any problem... Don't know whats happening.. Don't remember seeing this thing in LV 6.1..Anyone know what exactly is the cause for this.
This error message is comming from Windows, not LabVIEW. It happens when you double-click a VI to launch it from file explorer. LabVIEW 7.1 takes very long to load (longer than previous versions). This triggers some sort of timeout in Windows because the associated application (LabVIEW) has not launched yet.
-
I may be wrong, but my understanding is that you can only run a LabVIEW EXE on the platform for which it was built on.


LabVIEW Version Management Usage
in Source Code Control
Posted
Still waiting for your summary...