-
Posts
97 -
Joined
-
Last visited
-
Days Won
7
Content Type
Profiles
Forums
Downloads
Gallery
Everything posted by Taylorh140
-
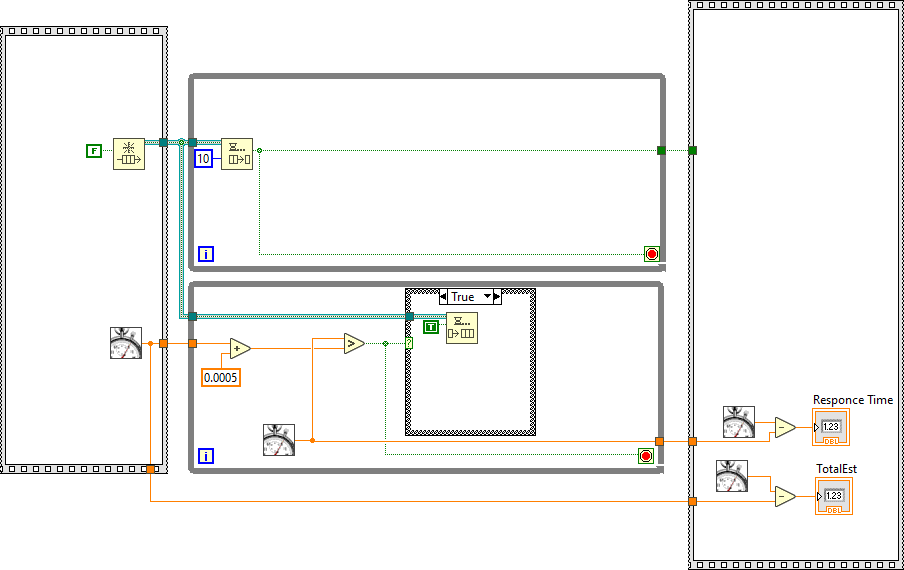
In the example above I'm more interested in how NI implemented the waiting on the queue. It seems to have better performance than I would imagine possible. I probably made some bad assumptions on the example. Assumption 1: Two while loops run on different threads. Assumption 2: If threads yield to OS response of queue would be > 1ms on average. Assumption 3: If threads actively wait CPU usage would be high. Assumption 4: Neither of these methods make sense with the information collected.
-
So lately I have been more interested in scheduling. Two methods I am aware of are below. This is in the context of Windows OS btw. Active Waiting (polling) Know for High CPU usage Accurate to less than 1ms Yielding OS wait (Thread telling OS give someone else my time slice) Very low CPU usage Takes OS integration (e.g. less portable) Much less time accurate jitter etc. expect best performance to be 1ms resolution So I have been curious about the timeout function of the deque element for a while. To me waiting on this seems to take little to no CPU usage. but has much better than 1ms resolution. 30us +- 10us in the example below. How can I replicate this kind of performance? Is there a secret method I am not aware of (reality says yes)?
-
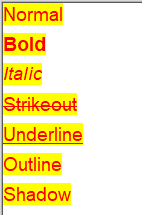
I tried to do a test to see if any of the windows fonts do anything. (forgive the long image). I'm starting to wonder if windows has this function in any form. perhaps there are some fonts that do work but the ones included with windows do not seem to do much:
-
In The Draw Text at a Point VI under the user-specified font there are two settings that I do not understand. -Outline - seems like it should put a black outline or something around the text. as far as i can tell it doesn't do anything. -Shadow - seems like it should put a darker outline around part of the text. as far as i can tell it doesn't do anything. How do these work or lack there of?
-

Can Queues be accessed through CIN?
Taylorh140 replied to Taylorh140's topic in Calling External Code
Wow, Thanks! It's good to be wrong. It does sound though I was right to be weary of calling DLL's meant to call LabVIEW functions, especially when LabVIEW versions change. But it sound like LabVIEW calls its own exposed functions (lvrt.dll i assume) when dealing with Queues. I wonder if building a dll for calling the queues and then debugging these would give me the prototype. (following the data to the builtin's) #unrecommended but a quick way to do devious things. (most likely learning that it is a bad idea and leaving it alone ha ha). -

Can Queues be accessed through CIN?
Taylorh140 replied to Taylorh140's topic in Calling External Code
I thought about this. I was initially turn off because code called from a dll supposedly runs in a different application space. I was concerned I would not be able to access queues by name through the divide. But I guess that plays well to me now knowing enough about the different run (domains) available to LabVIEW. I guess i wouldn't know where to look up the details for these. The Actor framework seems to use these. DLL calls can use these depending on the settings. -Is it just a head-free version of LabVIEW but sharing application memory? is this where the AZ and DS memory differences come in? more to learn here clearly. I got the PostLVUserEvent to work nicely.. I am working in Rust to see how the two play together, which is a new experience for me. It also gives some nice promises about how the safe code will work... but so far everything to do with this interface is currently unsafe :). This also means that most of the goodness of the language doesn't apply, but i can wrap up all the unsafe things in nice calls and get a good interface. Here is a sample of how the interface can look in rust. #[no_mangle] pub extern "C" fn AddONE(ptr:LvUHandle){ let h=LvArray1DW::<f64>::from(ptr); //Wrap pointer and get type as a 1D array of doubles. let g=h.to_array_mut(); // Access mutable slice for i in 0..g.len(){ g[i]=g[i]+1.0; // Add one to each element } } Note: I am using LabVIEW Handles for array in windows (but the pdf describing the interface says that windows array handles are not supported .. why?) Note Response: I guess the documentation says the Windows API does not support LabVIEW handles, like user32.dll not the LV interface to the custom DLL. -

Can Queues be accessed through CIN?
Taylorh140 replied to Taylorh140's topic in Calling External Code
Odd that Occurrences are documented but Queues are not? I had a feeling that it might be undocumented. LV User Events have nearly the same properties, so that is nice (however these seem more tedious). I might try playing with these functions if I can figure out the prototypes but if not there is just too much to guess. I'm not so familiar how the OS-native api's play with Labview. Other than using TCP/IP. Thanks @dadreamer! -
I was looking through the Labview.lib (its just an archive) functions and found: Line 1162: ./objects/labview_lib/win32U/i386/msvc71/release/QueuePreview.i386.obj _QueuePreview Line 1211: ./objects/labview_lib/win32U/i386/msvc71/release/QueueTimeoutRead.i386.obj _QueueTimeoutRead Line 1231: ./objects/labview_lib/win32U/i386/msvc71/release/QueueLossyEnqueue.i386.obj _QueueLossyEnqueue Line 1238: ./objects/labview_lib/win32U/i386/msvc71/release/QueueStatus.i386.obj _QueueStatus Line 1286: ./objects/labview_lib/win32U/i386/msvc71/release/QueueDequeue.i386.obj _QueueDequeue Line 1348: ./objects/labview_lib/win32U/i386/msvc71/release/QueueObtain.i386.obj _QueueObtain Line 1691: ./objects/labview_lib/win32U/i386/msvc71/release/QueueEnqueue.i386.obj _QueueEnqueue I assume that means i can interact with Labview Queues in application space, which would be a nice way to transfer information and call back. But I cant find any documentation on how to use these eg. documentation or prototypes. If someone can point me in the right direction that would be great!
-
So this apparently is the same with MATLAB: https://www.mathworks.com/help/matlab/ref/plus.html In the section: Add Row and Column Vectors a = 1:2; b = (1:3)'; a + b This simple code will not compile in Mathscript its the same story with Add Vector to Matrix It's just a seemingly basic incompatibility and it seems it has something to do with how vectors are handled in basic operations. unless there is some super secret setting to make these compatible ill just have to find a workaround.
-

Calling arbitrary code straight from the diagram
Taylorh140 replied to dadreamer's topic in LabVIEW General
No this is definitely cool. It’s cool to know that there is a way to keep the data in the same scope. Now all you need is a (c compiler/assembler) written in labview along with prebuild actions and the world would be your oyster.- 12 replies
-
I was working on octave with a simple script: im=[3.5 ;3.5 ;3.5] ip=[1/3 ;2/3 ;3/3]*2*pi w=2*pi*15 % 15Hz signal dt=0.0005; t=0:dt:0.05; th=w.*t; i=im.*(sin(th+ip)); % generate abc to generate 3 sinusoids offset by 120 degrees. However Mathscript seems to choke on (th+ip) I'm not actually sure what operation is happening or rather octave has some type of extension to the addition operation. I like the convenience of the above method. but I can't figure out how to do the same thing in mathscript without a for loop.
-

What do you think of the new NI logo and marketing push?
Taylorh140 replied to Michael Aivaliotis's topic in LAVA Lounge
What i think.... -
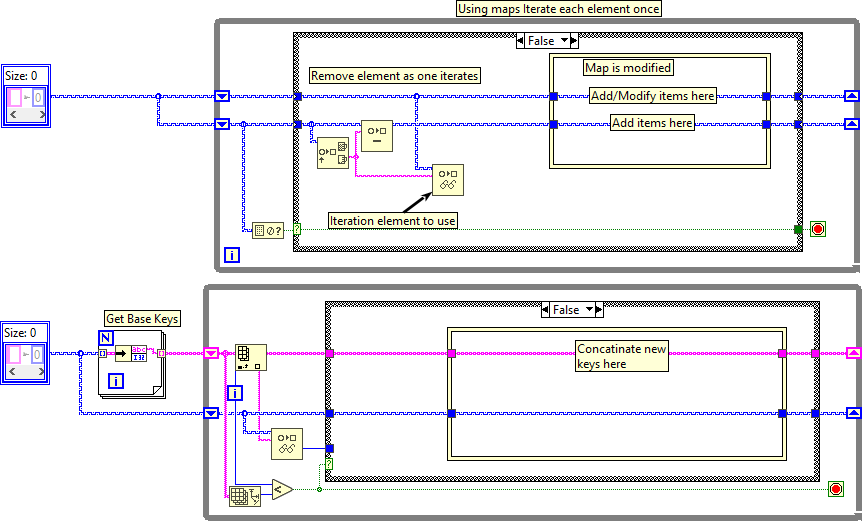
So the way the map works is we can iterate all elements in the map by indexing on the input of a for or a while. However, This only works for a non-changing Map. if you are adding elements during the loop is there a good way of iterating all non-iterated items? Id like to have a version without a duplicate structure: I have these: This might be the best that can be done. but I thought id ask.
-
@jacobson I agree that is a way to use it. but it seems like a waste of potential leaving it at just the wall of text. especially since the c++ guys can get fancy profiling tools like this one: https://github.com/wolfpld/tracy (so pretty) And i think I'm not the only one that would write their own tool to present the data if it we could get of all the necessary information. It is just a little disappointing. I became a squeaky wheel: https://forums.ni.com/t5/LabVIEW-Idea-Exchange/Desktop-Execution-Trace-Toolkit-should-be-able-to-present-data/idi-p/4046489 Y'all are welcome to join me.
-
Ahh, This is too bad. I wasn't aware of Real-Time Execution Trace Toolkit. I Guess the title should be more explicit Is there any way to make similar reports using the DETT? (Theoretically?) My eyes always glaze over looking at the wall of text generated from DETT. VI Calls and returns are matched by the tool (Higlighting) but i cant find a way to get this information exported.
-
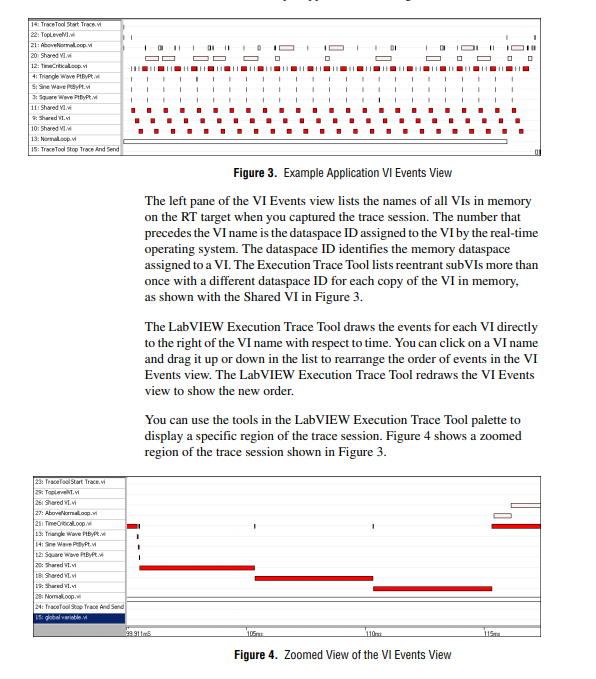
I was looking at a user guide for the Desktop Execution Trace Toolkit. And I found this: A pretty graph! ref: http://www.ni.com/pdf/manuals/323738a.pdf I would love to see this kind of detail on my applications but i cant figure out if it was a dropped feature or what the deal is. It sounds like it should just work by default. Maybe its just for real-time targets (lame)? I cant even export enough information from the DETT to redraw a graph like this. But many tools have this kind of execution time view, if it is part of the tool how to i access it and if not how could i get something similar?
-
Is this the trick where you have controls off-screen waiting to be moved into place? graphs are limited by the number of plots ready? I've also seen the setup where windows are embedded into the UI and reentrant VIs are use to plot. (setup is pretty non-trival though). I haven't really seen a solution that is nice and modular and easy to drop into particular ui being worked on. Is there another?
-

How to change content type of N-element cluster
Taylorh140 replied to Gan Uesli Starling's topic in LabVIEW General
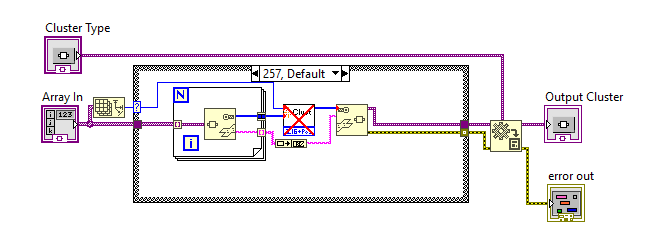
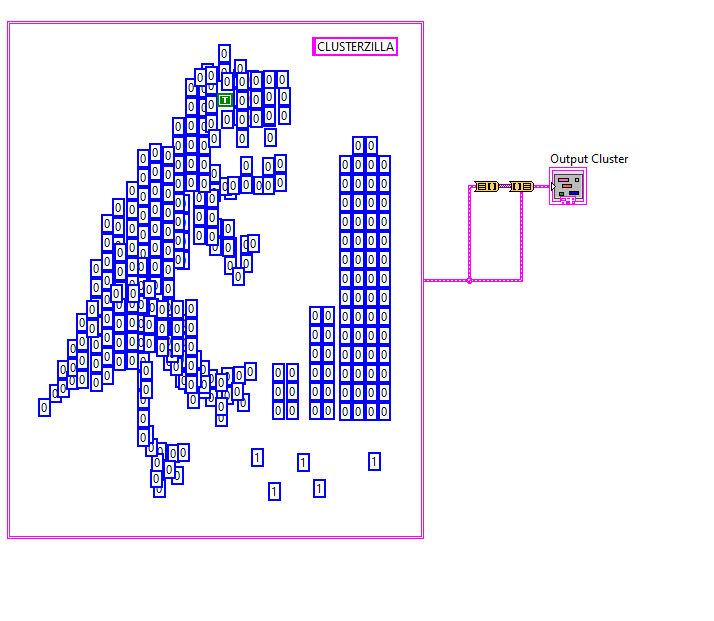
For a final Case. Sadly there isn't any non-depreciated Items to replace that vi. Which makes this work for Clusterzilla. ArrayToCluster.vim -
So, sometimes when i'm troubleshooting or perhaps the customer doesn't know what they want, its nice to make things a bit more flexible. However I find this difficult with plots, they take a good deal of setup and are pretty hard add remove things flexibly during runtime. I'm curious of any other examples or demonstrations/recommendations for doing similar things. I Made an example here of something that i'm working on for flexible runtime plotting: Plotter.vi Front Panel on PaintGraph.lvproj_My Computer _ 2020-04-22 11-04-10.mp4 Here i have some functions to be desired. I am using the picture control so i can add and change plots quickly. But it means more feature implemenation. I am actually forcing the start of the x axis to be aligned (visually not numerically). I still need to clear items and stack plots using colors and stuff, but its all doable during runtime. I thought I'd ask because its been something i have been looking into for a while, and i haven't found a solution that i like yet. Thanks, in advance.
-

How to change content type of N-element cluster
Taylorh140 replied to Gan Uesli Starling's topic in LabVIEW General
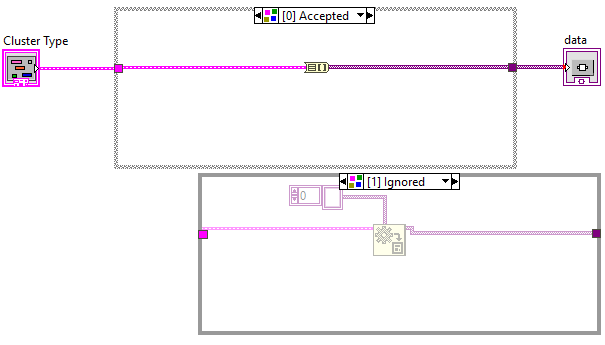
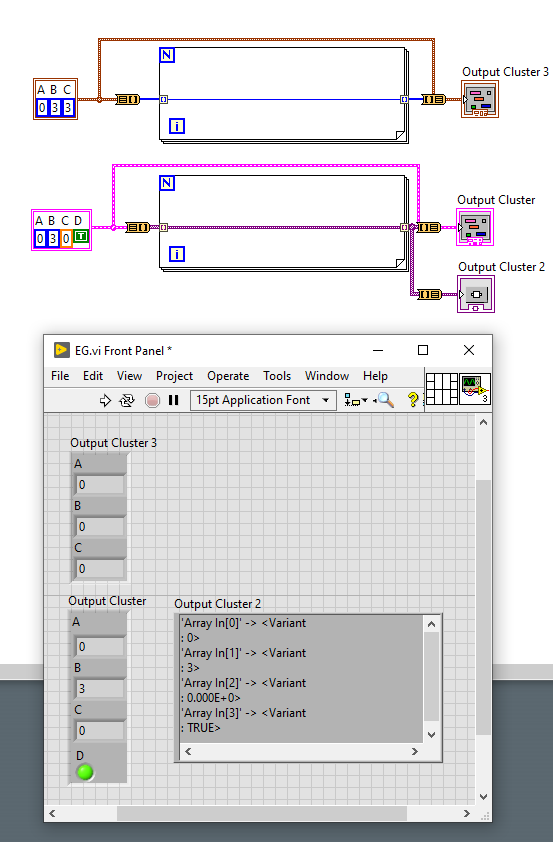
I think i knew about that one. Its quite effective, I just have a natural avoidance of using them in anything production related due to the (not supported stigma). The also use quite a few files, I wish LabVIEW could used fewer files. But mostly I wanted to take a renewed crack at this problem. I used @drjdpowell's solution so I wasn't doing anything unsupported (it should be available to anyone using 2019). (because of the type specialization) Custer To Array: (pass the type directly if possible) otherwise make them a array of variants. Array To Cluster: Get the cluster type and convert it to the proper cluster type. Pretty much this for 256 Cases . And Two special cases. I Suppose i want the Array to cluster and cluster to arrays to behave more like these by default. (its essentially a behavioral extension of the standard functions) -

How to change content type of N-element cluster
Taylorh140 replied to Gan Uesli Starling's topic in LabVIEW General
Here is another shot Late to the game i guess Its a 2019 vim that supports cluster size from 1 to 256. Contains forward and reverse operations. ArrayToCluster.vim ClusterToArray.vim -
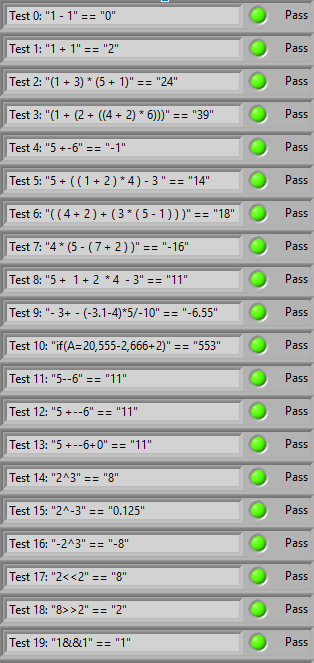
So there are so many ways to do evaluators. I was trying to minimize mess on the implementation (no recursion or any such nonsense) Single File capible(if function VI is removed) Contains tools for changing rules.(In the form of a spreadsheet) It uses variant attributes for the variable name space. Here it is: Made a nice and simple evaluator should be compatible with older versions of LabVIEW as well. And even gave it some test cases: Also check out the github page: https://github.com/taylorh140/LabVIEW_Eval I've attached the Eval and Functions.vi should be LV 8.0 compatible. Functions.vi Eval.vi
-
Nice simple find! Thanks for the tip.
-
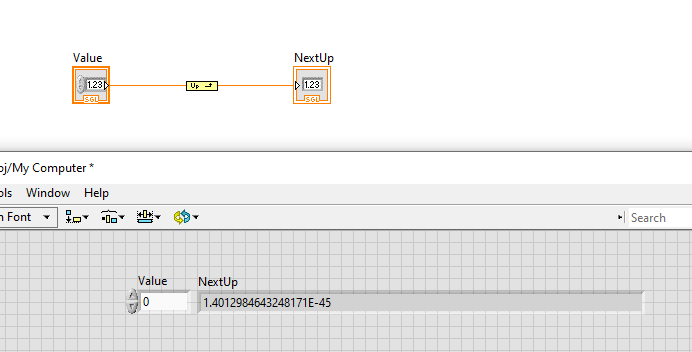
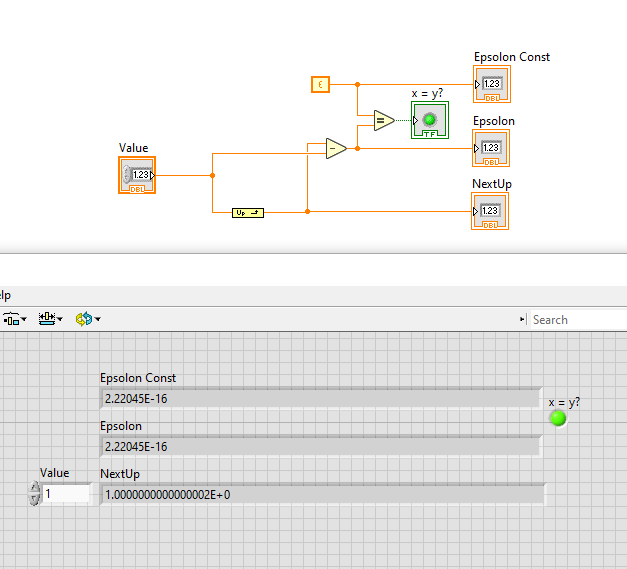
@X___ So.. the article is a little misleading in its description of epsilon. For a single float the first step from 0 to the next value is 1.401E-45 which is much smaller than epsilon (even for a double) In reality epsilon just represents a guaranteed step size minimum you can expect between the range of 0-1. Its calculated by getting the step size after one: I know that it doesn't count for larger values from experience. If you add one too a double it will only increment for a while before it cant represent the next gap. But I was curious what the epsilon was too. So hopefully that helps.
-
So I put something together. It implements NextUp and NextDown. I was thinking it would be nice to have a approximation compare that took a number of up/down steps for tolerance. Let me know if you think there is any interest. https://github.com/taylorh140/LabVIEW-Float-Utility If your curious please check it out, and make sure I don't have any hidden Bugs. 😁


