Gan Uesli Starling
-
Posts
76 -
Joined
-
Last visited


Gan Uesli Starling's Achievements
")


-
Set While Loop Timing Without Delay Function?
Gan Uesli Starling replied to Gan Uesli Starling's topic in LabVIEW General
cDAQ NI-9174 with an NI-9219 -
Set While Loop Timing Without Delay Function?
Gan Uesli Starling replied to Gan Uesli Starling's topic in LabVIEW General
I have pared down the VI to its barest essentials ... which I am now able to share. As you can see, there are no delays. Yet it is iterating on 500 ms very precisely (after cycle zero). How so? I wrote it myself, a year ago, and thought it very clever at the time. Now, though, I'm at a loss. However I did it, when I email it to myself on another PC, running a different version of LabVIEW, and assigning a different cDAQ device ... still it adheres to the 500 ms loop timing. Maybe this serves as a clue? Example.vi -
Set While Loop Timing Without Delay Function?
Gan Uesli Starling replied to Gan Uesli Starling's topic in LabVIEW General
Would not this task appear in the block diagram? If so, I fail to find it. Nor yet any file path leading to or from anywhere which might be a task. Still, what you describe jostles an inkling of memory. The actual loop time is 502 ms. -
I managed this once before. So it does work. A menu entry of some kind. A means of setting the iteration timing of a WHILE LOOP without any kind of delay or wait function inside it. I'm looking directly at the VI's block function. I've been staring at it for hours. It's not even all that complicated: a screen and a half of well-spaced icons. Data lines not at all crowed. While running, it iterates nicely on precise 500ms intervals, taking readings and accumulating an average. Nothing in the task about timing. Nothing, anyhow, that shows as an icon. Sadly, I can't share it here. Company will not allow. I remember thinking at the time, "How obvious! Why have it not always done it this way?" A menu selection of some kind, affecting data collection inside a While Loop. Who has clues?
-
Generate 3rd Order Polynomial from 2D Data?
Gan Uesli Starling replied to Gan Uesli Starling's topic in LabVIEW General
Two lines or one, it is no different than if I were using a dead weight calibrator and adding on a different set of weights. The recording instruments are unchanged. There has only just been a pause. I have myself done this very thing, but with fluid pressure as opposed to dry gas mass flow. I have employed a pneumatic-lift dead weight source for pressure to collect data points at the low end of a sensor. Those points collected, I will then switch to a hydraulic-lift dead weight source for pressures on the high end. And when doing so, I'll start out below the high end of the prior data as proof to myself that there is no bubble trapped in the hydraulic line. And once sure of that, to also make sure that the second set of dead weights is at the same column height. So it is both: in one sense, two lines; in another sense a single line having two segments. The same as if I were to draw a line on paper, then lift my pencil for a moment, and afterwards continued on from where I'd left off. That is how the results must be treated by the instrument under cross-calibration. It can't call two functions, one after the other. The published requirements for this test stand historically calls for a 3rd order polynomial as computed in Excel from data like the above. Which line must plot within a given (very small) percentage of the furthest outlying datum. I will be proposing an update to this (very ancient spec) to allow the inclusion of a spline curve as an alternative to the 3rd order polynomial ... this with some constraint upon linearity. I thank you (ShaunR) most kindly indeed for your very timely assistance. -
Generate 3rd Order Polynomial from 2D Data?
Gan Uesli Starling replied to Gan Uesli Starling's topic in LabVIEW General
All is now clear. I telephoned an engineer at the calibrating service. These calibrations are performed on an automatic machine that employs two sources of pressure, one low and one high. But with the same recording instrumentation. Thus, on switch-over from the low source to the high source, they repeat the same point. Thus to obtain double repetitions at each point on each source of pressure, but the same measuring instruments taking data. -
Generate 3rd Order Polynomial from 2D Data?
Gan Uesli Starling replied to Gan Uesli Starling's topic in LabVIEW General
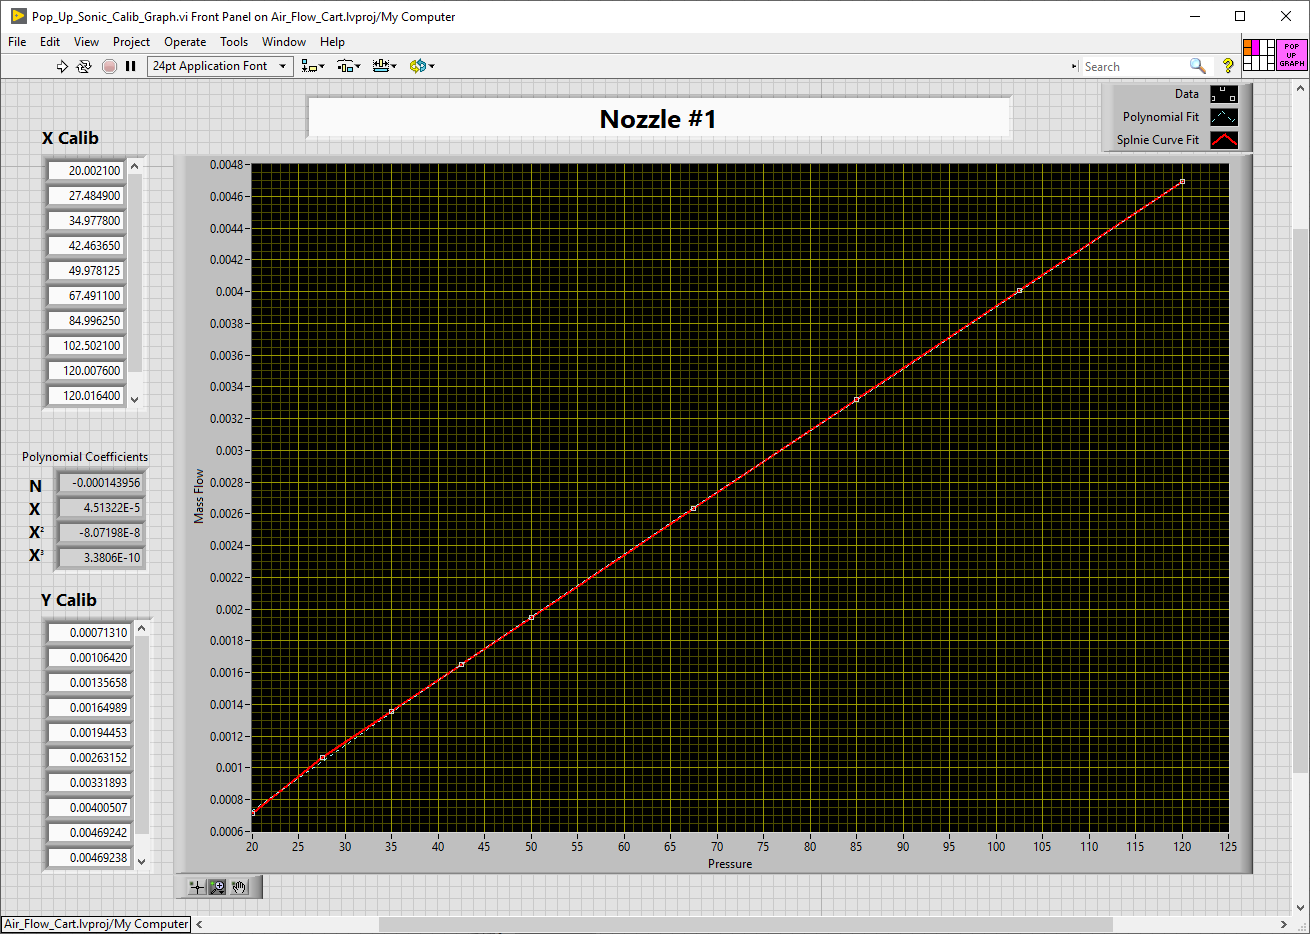
Your point is cogent. And I can now see where you are persuaded, there being doubles to half way, and doubles again for half above that, with the quad group at center belonging half to the lower and half to the upper. However... I believe there was a typo in the list of two columns I presented at top of thread. Seeing a glitch, I found and corrected that one number. After which, the anomaly disappeared. The item is a critical flow venturi (aka "sonic nozzle"). The calibration sheet is a single table of twenty points and five columns: pressure, temperature, Cd, Reynolds No, LBMS and C*. This together with a table of uncertainties and a single graph plotting a 4th order polynomial curve of Reynolds No versus Cd, with overlapping near-duplicate points. Nowhere in the calibration sheet is there a separation into two flows, low and high. Nor any separation of ranges in the history of cross-calibrations done in-house from said sheets prior to now. Plus the apparent two lines, end of low and start of high, meet very cleanly. So I'm pretty sure that the table is as I assume. Nevertheless, I shall inquire, just to make absolutely certain.
-
Generate 3rd Order Polynomial from 2D Data?
Gan Uesli Starling replied to Gan Uesli Starling's topic in LabVIEW General
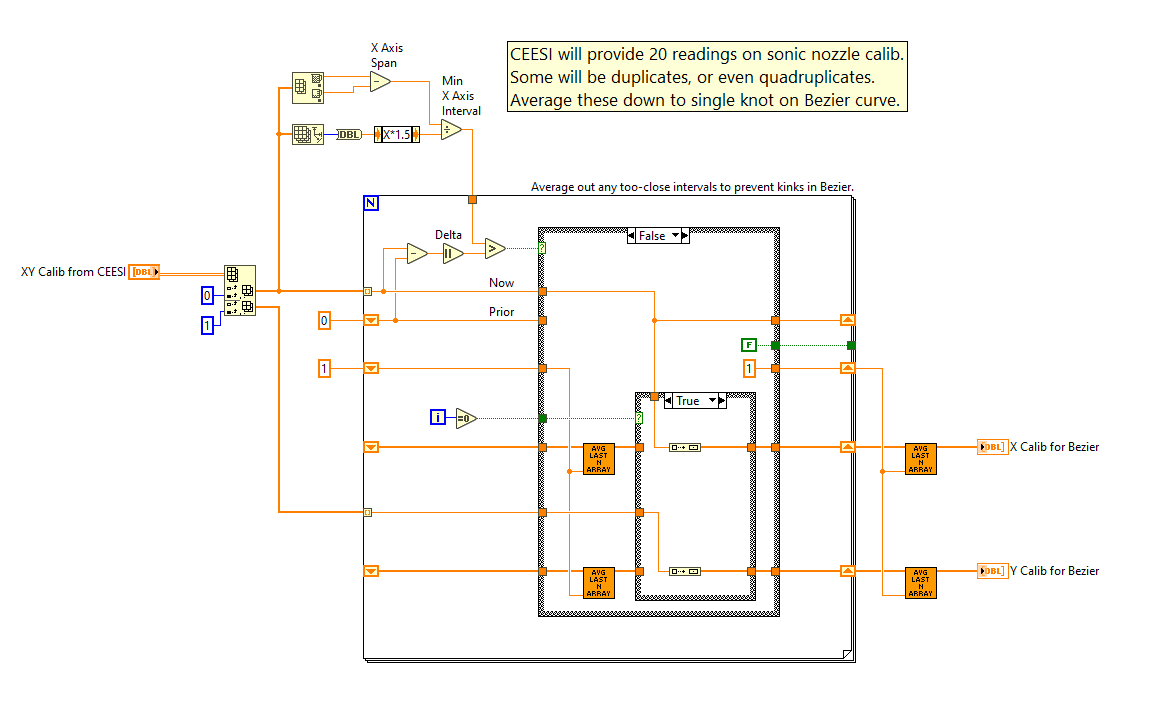
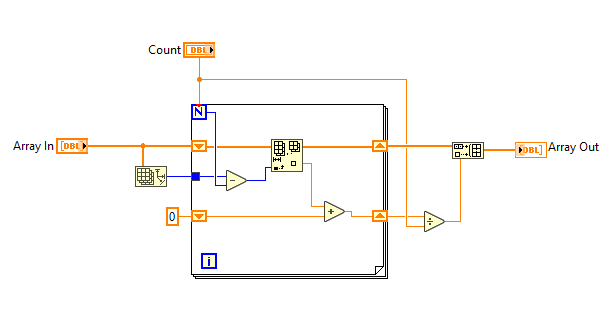
The two columns are excerpted from a calibration sheet for a sonic nozzle (device to measure mass flow of gas in relation to pressure). We have a spec that requires Excel to generate a 3rd order polynomial for use in scaling an instrument's output based on said calibration sheet. So historically, we'd take that 3rd order polynomial and employ it as the scaling factor in the instrument. I am wanting to get away from that. I want to do so by putting the columnar scaling data itself into LabVIEW as an array. Generally, I prefer to use a spline curve instead. That way I can enjoy many pairs of calibration points to define a curve. And spline curves REALLY hate those redundant points within the noise level. So I wrote a routine to average them out, wheresoever they might occur, however many there might be. I have always used spline curves in my original test stands. Those we calibrate in-house from first principal standards (dead weight, etc). But this is a legacy test stand which I'm converting over to LabVIEW. So for any changes, I must first run the gauntlet of "Tradition" from an eon before. And in any case, we lack any first principal standards for mass flow of gas, so these sonic nozzles get sent out for that. And I must deal with their own data format, as is. Attached are my two VIs (one a sub-VI of the other) for auto-averaging any series of N redundant rows in a messy table of data like that supplied at top of topic. Kink-Free_Bezier_Calib.vi Array_Avg_Last_N.vi Kink-Free_Bezier_Calib.vi Array_Avg_Last_N.vi
-
How would I go about deriving a 3rd order Polynomial from data like the two columns below, and do it inside of LabVIEW? Wanting to do this LabVIEW directly as opposed to in Excel then transferring the polynomial into LabVIEW. Yes, I know that there are pairs of rows, even one quad of rows which are redundant. But this is how we get the calibration data from the source vendor. 20.00150000 0.00071310 20.00270000 0.00071310 27.48430000 0.00106420 27.48550000 0.00106420 34.97700000 0.00135657 34.97860000 0.00135660 42.46360000 0.00164990 42.46370000 0.00164989 49.95510000 0.00194370 49.95600000 0.00194366 50.00030000 0.00194537 50.00110000 0.00194537 67.48960000 0.00263146 67.49260000 0.00263158 84.98750000 0.00331974 85.00500000 0.00331813 102.49060000 0.00400498 102.51360000 0.00400515 120.00760000 0.00469242 120.01640000 0.00469238
-
Wanting to rotate an arbitrary 3D point, cords X,Y,Z relative to XYZ location 0,0,0 in a 3D system. But all I find is Math/Geometry/3D Rot (direct and euler) which both take ARRAYS for their input, and a 3X3 ARRAY for it's command. I do not grok this concept at all. What's going on? How can I use it instead to deal with a single point (anywhere) relative to the system origin? Problem relates to a calculator I have built for the design of log-periodic antennas. The antenna consists of wires, paired as XYZ_from and XYZ_to with also a subunit 'segments' for each, thus a 4xN array of (X,Y,Z,Segs) of arbitrary length. First wire is always on the origin. So I'm wanting to perform pitch/roll/yaw on this antenna from point 0,0,0. But do it by running my coordinates X,Y,Z for each wire-end, one set at a time, through a transformation filter. And the whole 3x3 matrix makes no sense to me. Sorry, I'm 30 years out of college. This is a hobby project for a calculator I'll give away free. Can someone clue me in?
-
We have a gage supplied by a company that shipped it with a *.exe application targeted for LVRTE 2009. I need to retarget it for 2017, but don't have the source code. The supplier had said they'd gladly supply me with a copy of the *.LV source, but they have looked and cannot find their own copy in-house. History of Need: Our global corporate mother ship's IT department, in their infinite wisdom, is mandating an upgrade from Win7 to Win10. That with yet even further constraints. They enforce a list of "approved versions" of "approved applications". And for LVRTE, they are insisting upon 2017, with 2009 being a red light. So, then, my query. Is converting an app without the source for a higher LVRTE doable at all? File is attached. If it is doable, instructions on how? Concentricity-Gage.exe
-
There were some things I was wanting to do in my ham radio hobby for which I had no ambition to write a GUI in Perl. And so, now there is this: KY8D.net/free
-
It's a political thing. In my own department (Test Engineering) we are fully invested with LabVIEW. The test stand in question, however, belongs to another department. And they are devoutly enamored of Allen Bradley. Cost is no issue, my company has full, all-encompassing corporate licenses for both NI and AB softwares. I am considered something of the plant-wide hardware and software guru, if only because I've been here 12 years. But this project got handed to me already with the AB constraint. Bit of an uphill slog in my future, so it would seem: new hardware & a new authoring platform.
-
I am assigned to refurbish an airflow instrument having six pressure sensors, four temp sensors, and six on/off outputs. By preference I would use all NI hardware, but this isn't going to be allowed. I'm being pushed toward installing an Allen Bradley PLC instead. I am aware of another, much more complicated liquid flow test stand which, so I'm informed, uses LabVIEW for SCADA on a Seimens PLC. This being the case, cannot I do likewise with Allen Bradley? Can I do it entirely in LabVIEW? Or is something like that always just LabVIEW sending trigger commands and receiving data from a free-standing program written in the PLC's own native SCADA? I'll be starting from scratch, with nothing yet purchased. I can purchase whatever I choose. I have perused a couple of PDFs of Allen Bradley ControlLogix programs, and at first glance, to me they look like a major pain. Unlike LabVIEW, almost nothing shows on any one screen. Nothing at all looked to have been nested into a subroutine. I liked ladder and highway diagrams quite well enough back in the 90's when printed out on D-size vellum. Then, at least, I could stand back and see the whole thing. The same thing seen only through a tiny window that you have to scroll up and down I'm not looking forward to learning at all. Thus my hope for a LabVIEW solution, rather than purchase and learn AB's Studio 5000. I'm an old dog, and this looks like a new trick to me.
-
TCP/IP or GPIB to Thermotron?
Gan Uesli Starling replied to Gan Uesli Starling's topic in LabVIEW General
There are LabVIEW Drivers located here... http://thermotron.com/pdf/_service/labview7/TH88-8200.zip ...which I've downloaded and installed. But first I must make the initial connection, which is where I still suffer confusion for where to start. Were it RS-485, I'd just set up COM3 with one of my several USB-to-Serial dongles. I have such a dongle on order for GPIB to allow connection to the IEE-488 connector, but it will take some days to arrive. Meanwhile the RJ-45 beckons, so I'd like to firstly try that. Also with regard to the forthcoming USB-to-GPIB dongle, a page at NI located here... http://www.ni.com/getting-started/set-up-hardware/instrument-control/gpib-usb ...held forth an empty promise of info relative to Windows which it says is located here... http://zone.ni.com/wv/app/doc/p/id/wv-1648/ ...but that one is a dead link.