

Mark Balla
-
Posts
607 -
Joined
-
Last visited
-
Days Won
41
Content Type
Profiles
Forums
Downloads
Gallery
Posts posted by Mark Balla
-
-
Sign up for NIWeek 2011 and network with these guys


I want to know what's so funny on that computer screen

(PS - Ya, I'm just jealous)
When you get a chance to connect with developers from all over how can you not be happy.
This was taken at the CLA summit.
Heiko may remember better than I but we were either watching FRC videos or he was showing me his pig farm application.
This one is still my all time favorite.
http://lavag.org/topic/3463-nobody-nose/page__p__17271__hl__nobody+nose__fromsearch__1#entry17271
-
 2
2
-
-
Certified 11-13-2010
Placed in General Category.
-
Hello Mark
I am attaching the file. which I modified Main VI and I need few more things to do.. please . . . .
Below the graph I need to get one table
column1 : - We should give information for all the channels So we should write the channel numbers 1 2 3 4 5 6 7 8 9 10 11 12 13 14 15 16 ........
Column2 :- In this column we should tell the Minimum Base value with respect to Y axis in the graph. for example in the graph if we get the least base value for 2nd cycle as 0.35. we should indicate only that value. so we should give the least value for all the corresponding row channel value. for first channel 0.35 second channel 0.26 ..........
column3 :- similar to the above column we should give the maximum magnitude value in the graph for each channel.
Column4: Here this column is like ALARM. the difference between the peak value ( with respect to X axis) to the preceding peak value( X axis value) of any cycle should be in between 8 to 12. if the difference value is below 8 or above 12, it should switch on the light to the corresponding channel
Column5 :- if the base value/ Magnitude value of any cycle in the channel should be greater than or equal to 0.7 . if any cylce in the channel is less than 0.7. then switch on the light to that corresponding channel.
.......in my VI .. . . When ever you keep the cursor near to the channel number it will show some text. in the same way. I wants to see that for cursor. . . . . when ever I keep mouse on the graph it show that coordinates below that cursor it self...
OK Lets add one item at a time.
Please create a radio button for the channels as shown in the video.
Then we will go to the Next Item.
-
Hello Mark,
I changed few things over here in my VI. could you please see this and add some more features
I would like to discuss the things, which i need to have in that VI.
1) We should draw one table below the graph
and in that Graph we should write the first column for the Channels.
We have 30 Numbers.
we should tell the numbers up to where we have the data.
In the second column, we have
tell the least minimum base value in that channel.
Third column should tell the
average of all the peaks in that particular channel.
we are getting the values in X axis corresponding to the peak values now.
Here I would like to take difference between the preceding value
and we should identify, if the value less than 8 or greater than 12.
We should show one alarm in another column as
ALARM1 should be indicated with light.
for example if we have peaks 2.33 and 3.34 at 12 and 20.
we should make difference between these 20 and 12,
which is 10.
10 is in between 8 and 12 so no need to show the light.
2) we should have a print menu in FILE MENU.
we should keep all the options
( EXPORT to EXCEL FILE, OPEN ASCII FILE, PRINT) in FILE menu
3) we need to have the pop out function near the X and Y
axis asking the minimum and maximum values of the graph.
I am attaching my File here
I think you need to choose one thing to add and get it working
Then move on to the next.
At this point in the project I think that you need to take control of the code.
I still want to help you but you need to be the one changing the code and making it work.
I am able to make and post videos like the one I posted before.
Are you able to see the videos?
Here is a video of how to create a Radio button for a channel selector.
Please create one and add it to your code.
http://www.screencas.../t/lJCrAN3B5ksp
<object id="scPlayer" class="embeddedObject" width="1028" height="733" type="application/x-shockwave-flash" data="http://content.screencast.com/users/mballa/folders/Helping/media/78933397-426b-45fc-9752-ba67b7c04c7e/jingswfplayer.swf" > <param name="movie" value="http://content.screencast.com/users/mballa/folders/Helping/media/78933397-426b-45fc-9752-ba67b7c04c7e/jingswfplayer.swf" /> <param name="quality" value="high" /> <param name="bgcolor" value="#FFFFFF" /> <param name="flashVars" value="thumb=http://content.screencast.com/users/mballa/folders/Helping/media/78933397-426b-45fc-9752-ba67b7c04c7e/FirstFrame.jpg&containerwidth=1028&containerheight=733&content=http://content.screencast.com/users/mballa/folders/Helping/media/78933397-426b-45fc-9752-ba67b7c04c7e/Creating%20a%20Radio%20Button.swf&blurover=false" /> <param name="allowFullScreen" value="true" /> <param name="scale" value="showall" /> <param name="allowScriptAccess" value="always" /> <param name="base" value="http://content.screencast.com/users/mballa/folders/Helping/media/78933397-426b-45fc-9752-ba67b7c04c7e/" /> Unable to display content. Adobe Flash is required. </object>
-
1
-
-
Hello Mark, Could you please change the VI ? I don't know how to do that. I just wanted to design my old VI to this form thats it. I am not asking anything new.
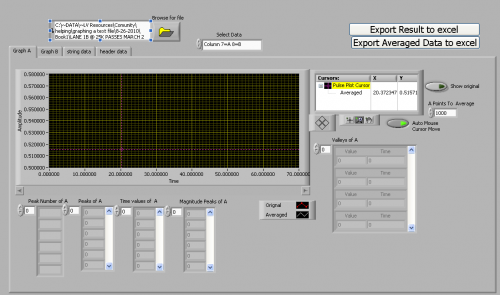
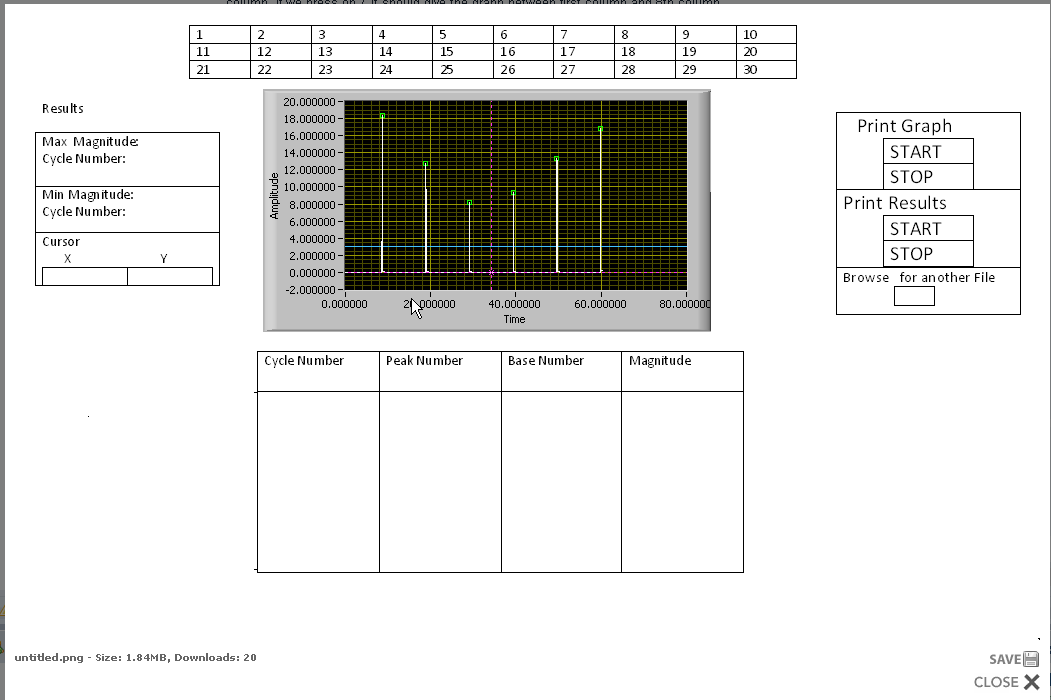
This is what the current Front Panel looks like.
and this is what you want it to look like
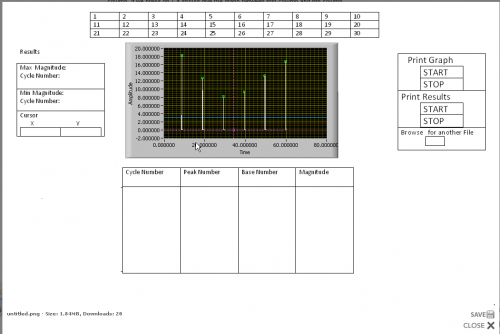
To me they look very different. Cycle Number, Peak Number, Base Number and Magnitude do not exist on the current front panel.
Currently the code does not "Print Graph" or "Print Results" so to make the code do these functions is new.
If you only want to change the look of the front Panel you can try some of these techniques.
Color:
1: Shift Right Click to bring up the tools pallet and select the paint brush.

Right click on the item you want to color and then select a color
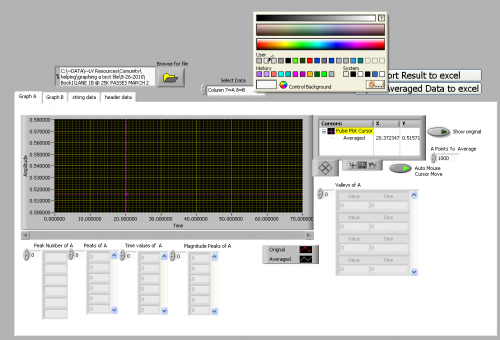
If you want to change the look of controls you can do this by using the Control Editor.
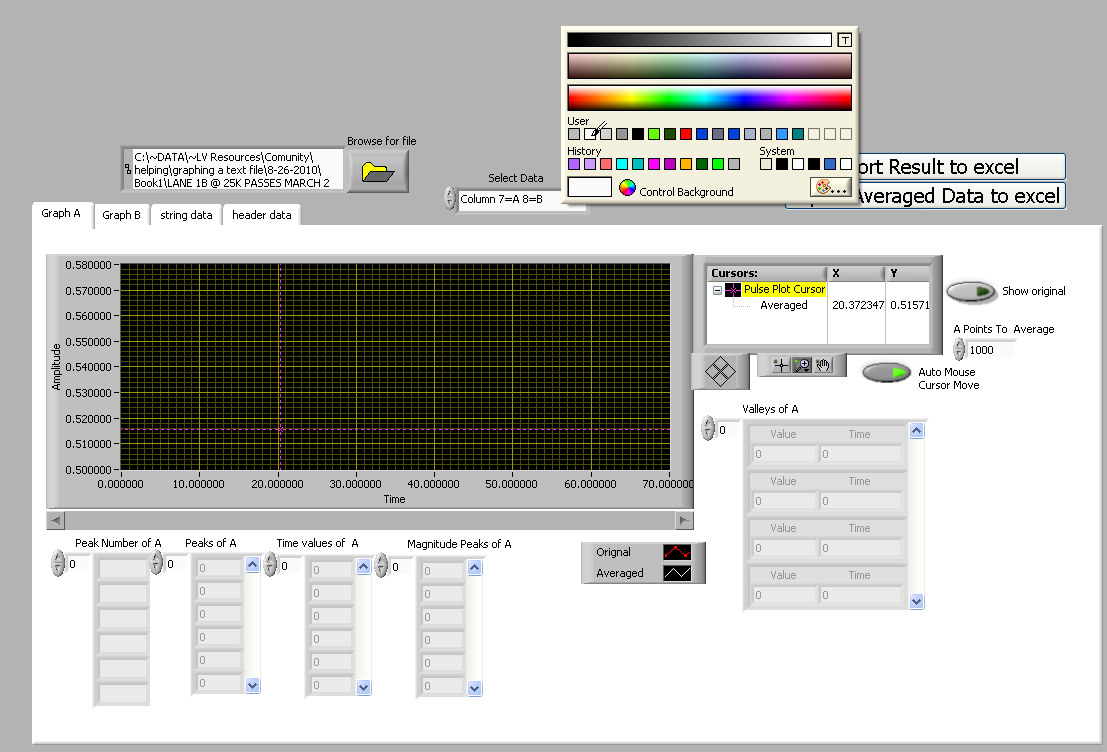
To find help on this go to LabVIEW help and "editor controls" in the search box then select "Customizing Controls and Indicators tat are Parts of Controls and Indicators" and read to the right how to use the editor.

Try this first and let me know where you are having problems.
Here is a video by Christina Rogers on how to use the control editor
There are also some UI videos here.
http://decibel.ni.co...10-presentation
Mark
-
1
-
-
When I submit newer code to the CR, the date seems to be stuck at the old time. I submitted a newer version today, but the date is the original submission date:
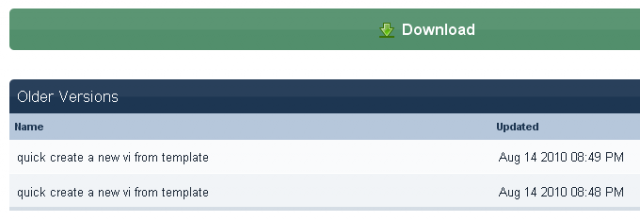
Or am I doing something wrong? -> I edit my older submission.
It's not really inutitive how to submit newer versions in the CR. There are two buttons to submit code, that create a complet new entry.
Felix
Hi Felix,
I agree it is not very intuitive to add new updates.
One thing to note is that every time you edit (even if you are just changing text) the CR will create a new entry in the down load list.
Even though these items are identical it still creates them.
Another thing that the new software did was put the title of the software as the Name instead of the file name as it did in the previous version.
This is why we are now asking members to change the title name each time they edit their submission so users can see the new version instead of guessing.
The title needs to now include the version number and LabVIEW version it was written in.
Let me know if you have any more questions on the CR.
Mark
-
Mark Is it possible to design a VI, as i mentioned in the earlier Post.
Try and make the Front Panel look like you want first.
Then try and add the code to make it work.
When you run into a problem then post it and we will help you.
Mark
-
Hello Mark. I designed the VI in some what better way. and I would like to make it a user friendly VI.
I am attaching the copy of the file. Open the version5.2. verify the main file.
In the second file, You can understand the way to design this VI. in that the numbers 1 2 3 4 5 6 7 8 9 ..... indicates the Channels number.
If we have 9columns in our VI,
1 to 8 Numbers should be highlighted.
If we press on 1 it should give the graph between first column and second column,
If we press on 7 it should give the graph between first column and 8th column.
Avinashgogineni,
It is great to see that you are taking ownership of the program and making improvements on it by yourself.
Very good job on the auto cursor following the mouse. I learned something from that code.
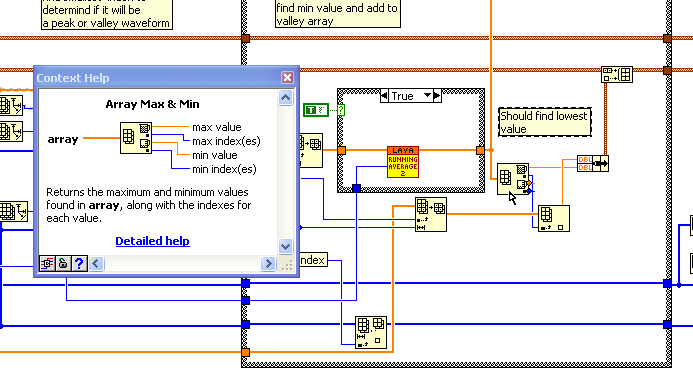
While I was looking at the code I found a bug that was in my code that I posted.
In the "Find Peaks and Valleys.vi" go to the "False" case in the case structure.
In this case it is supposed to find the min values but instead it selects the max values
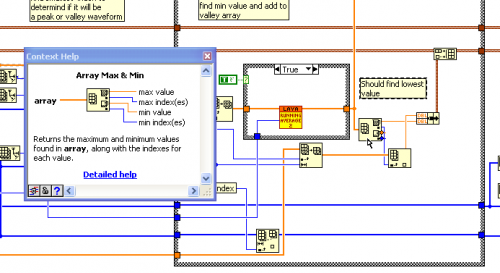
I fixed this problem in the current version.
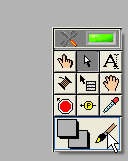
I changed the "Export Result to Excel" event case to unbundled for the main cluster instead of using local variables.
local variables can lead to problems so I would only use them if you have no other choice.
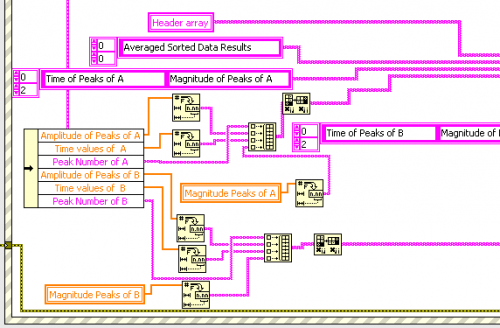
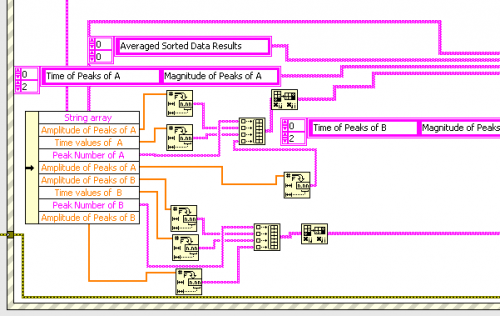
Above the tab control I added a "Select Data" Enum to allow you to select the columns to calculate.
I'm glad the code is working well for you.
-
Hello Mark. I designed the VI in some what better way. and I would like to make it a user friendly VI. I am attaching the copy of the file. Open the version5.2. verify the main file.
In the second file, You can understand the way to design this VI. in that the numbers 1 2 3 4 5 6 7 8 9 ..... indicates the Channels number. If we have 9columns in our VI, 1 to 8 Numbers should be highlighted. If we press on 1 it should give the graph between first column and second column, If we press on 7 it should give the graph between first column and 8th column.
If you have any doubts please respond to this post.
I can't review it because you have locked the block diagram.
Please do not post code to LAVA with block diagrams locked.
-
Hello,
For the past few days I have been searching the web for an explanation how to use interrupts. I didn't find anything useful.
All the code bits I have seen untill now talked about a timed loop.
Is it possible to use interrupts to execute a certain VI the second a microswitch is clicked? If so, please tell me how.

Many thanks,
Itamar.
P.S
I'm sorry if this is the wrong category for this... I wasn't sure which was the right one.
Can you give us an idea of what your target Platform will be PC, RT, FPGA?
Also what is the purpose of the interupt?
Will it start, stop, trigger...
Interrupt isn't a common term in the labview world.
Mark
-
Certified 10-9-2010
Placed in Database & File IO.
-
-
I am unable to understand what it is you want.
It sounds like you want to bring back averaging.
So here is version 5
The program will average only the points below the threshold.
The points above the threshold will not be changed.
If you change the "A Points To Average" and "B Points To Average" numbers the graph will redraw.
The bigger you make the numbers the flatter the curve will be.
-
Go back to our previous discussion here
Download version 2
Then tell me if this is what you want.
If yes then I will put the calculation in the new code.
-
How many points do we average together.
How do we know this number?
-
Do you want to go back to averaging all points?
If you do how many points do we average together. How do we know this number?
-
-
1
-
-
Hello Mark I am unable to open this file I am getting these errors. Could you please help me here?
Sorry didn't do the source distribution correctly.
Try this one
-
Hello Mark I tried this thing see here,
Export new is the main file , which i have done see it once.
After seeing that results I cam to know that thing,
Even peaks may vary. It doesn't matter,
I do not understand what you want me to do here so I will leave the calculation the same as before.
but i need have that tool tip in my VI. When ever i keep my cursor near to the peak, it should give the peak number and Coordinates of X and Y. Here tool tip should have button in the VI. If we click on that and then that function starts working. If it is not clear please look at my previous post you can understand better or else I will explain indetailed again
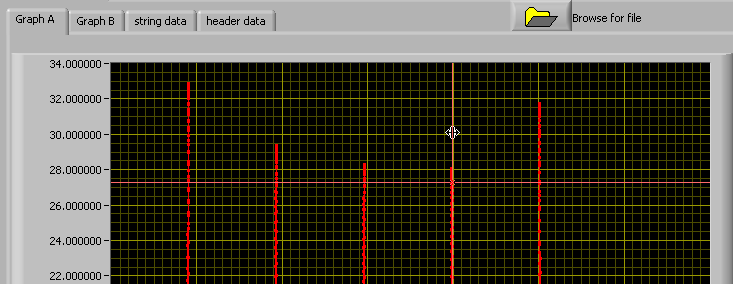
I've added two new features to this code.
1: The peak and valley arrays are combined with time so each peak point you can see the value and time in the array.
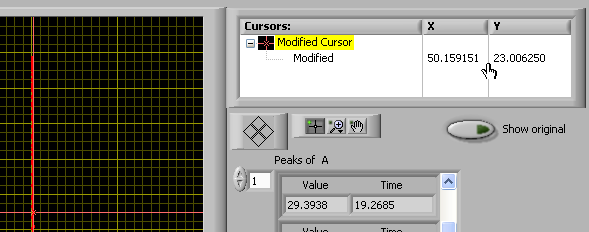
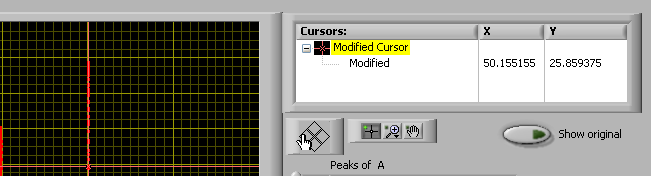
2: I have added cursors to each of the graphs. This will allow you to drag the cursor around to any point you wish.
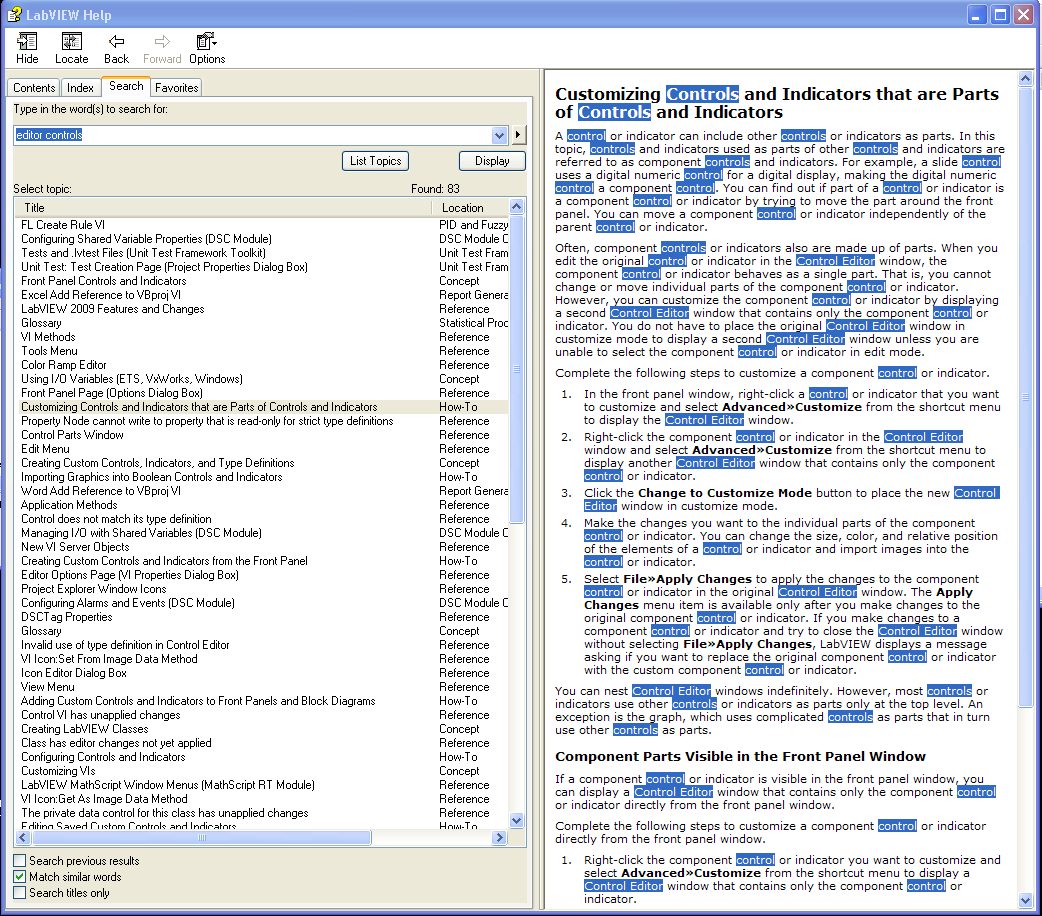
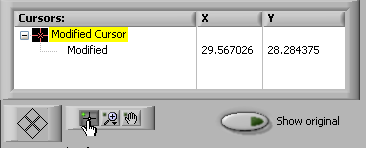
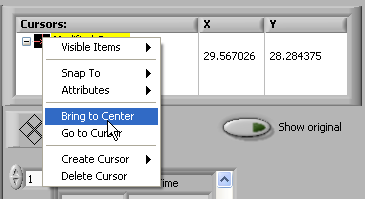
To use the cursor select the cursor tool (see below)

right click on the cursor and select bring to center

Place your mouse over the cursor line until you see the double arrow
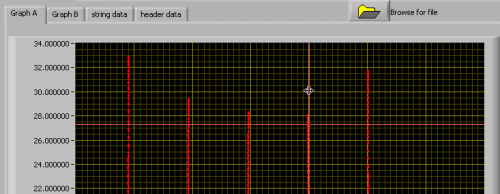
Move the cursor to where you want. and the value and time will show in the cursor box

If you want to move the cursor one point at a time click on the square arrow buttons

-
I would like to someone build a program from scratch using their chosen framework. Kind of like a statemachine vs statemachine but at a more detailed level.
Niweek presentations.
I have AQs if you want it.
usergroup presentations.
Mark
-
I'm back.
I only have access to LAVA via my phone so this will be short.
The sharp edge is due to the fact that all data below the threshold is set to the same value. This is what makes the data flat or smooth. What is the reason to round the sharp corners when the smooth data has no meaning. I thought you only cared about the peaks.
Have you changed your mind and do you now want to go back to an average or mean of the data below the threshold?
-
Certified 9-18-2010
Placed in the JKI RCF category.
-
Here is what I have so far.
I took the calculations and put them in a JKI state machine.
I also added the menu functions you asked for.
I will try and add the graph annotation and comment on the look of the curves in a later post.
-
Certified 9-15-2010
Placed in Quick Drop Plugin Category.
-
1
-


[CR] MemBlock
in Code Repository (Certified)
Posted
Certified 1-2-2011 Placed in General Category