

Mark Balla
-
Posts
607 -
Joined
-
Last visited
-
Days Won
41
Content Type
Profiles
Forums
Downloads
Gallery
Posts posted by Mark Balla
-
-
Certified 4-28-10
-
Hello..
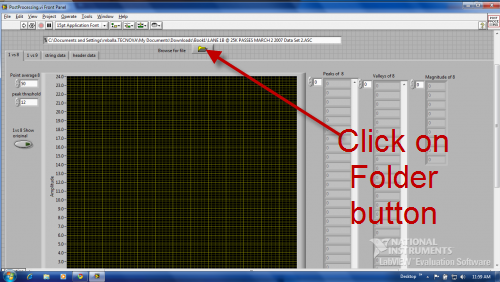
Here we have browse file.. how can we attach a file directly from FILE -> OPEN . I hope it is possible with that? how can we try for that?
If you click on the folder button you will be able to select the file to be analyzed.
-
Hello Mark,
I have a problem with this VI. The number of pulses it is showing in the raw data is not same as the number of pulses after averaging.....
You need to provide more information (Data, Screenshots, program settings.....) before I will be able to help you.
-
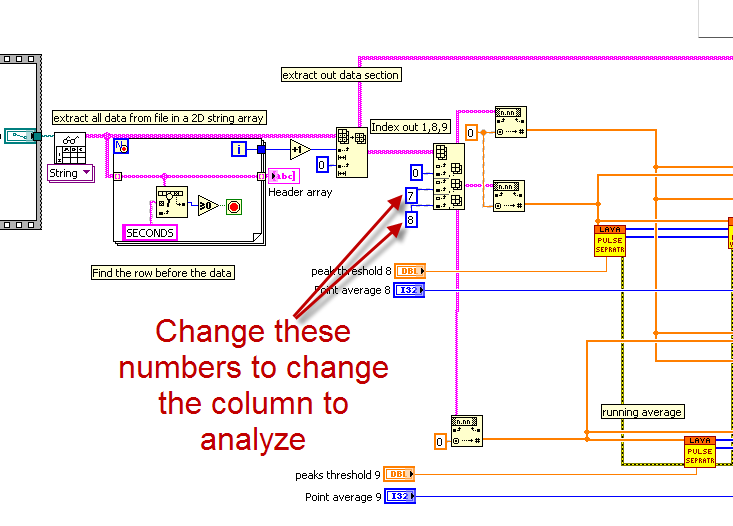
Hello Mark, here we have written the code to draw graph between 1st and 8th column, 1st and 9th column.
Is there any possibilty to write code to draw graph between 1st and last column, 1st and Last but one column ?
To change the column that you graph is as easy as changing the column index numbers shown below.
-
I noticed that the base line is not straight line...
How can we get that?
When you say base line I am assuming that you are referring to the part below the threshold.
It's not straight because the data is not "straight"
the lower part of the waveform is averaged from the original data.
You will have to explain more why the lower part needs to be straight.
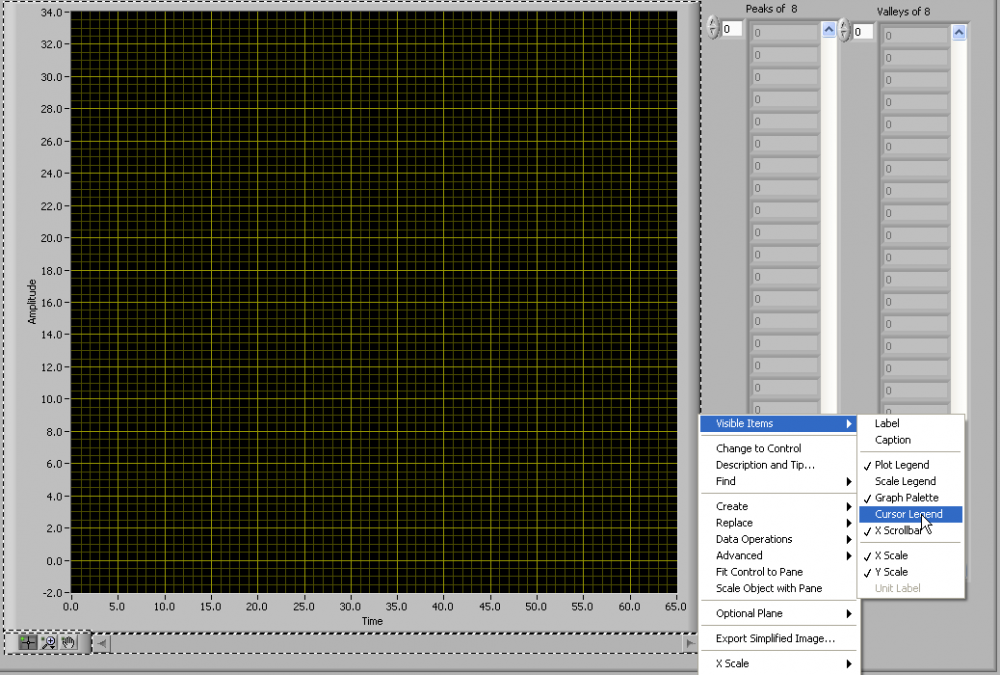
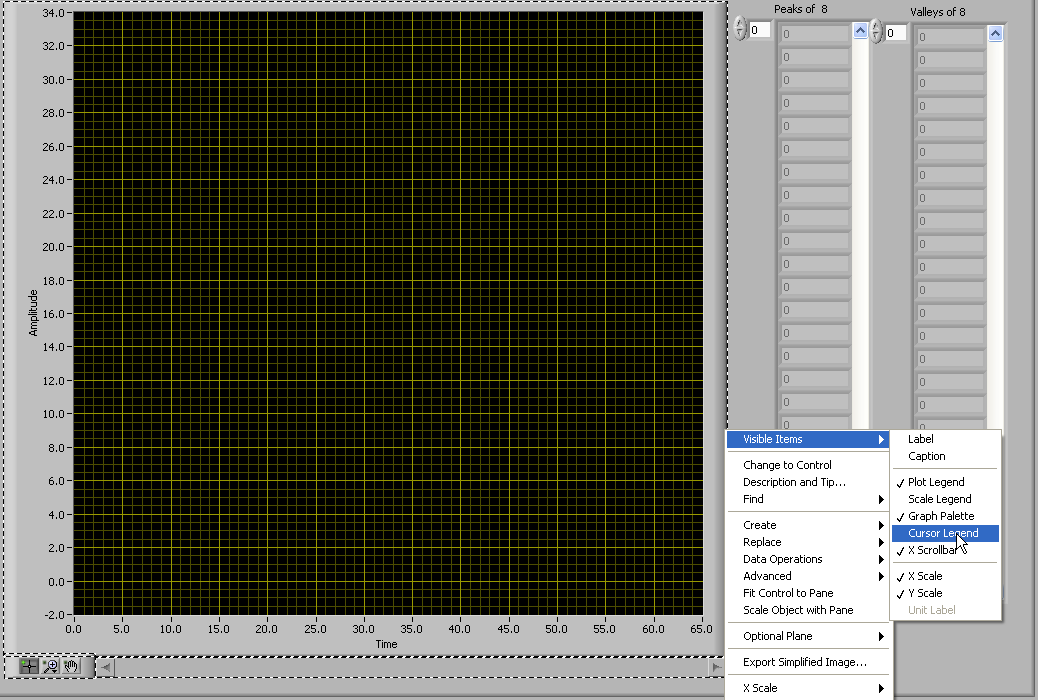
After that, If we keep cursor near the pulse it should be in a position to show the peak and valley of that particular pulse in that waveform like tooltip
If you right click on the graph and go to Visible Items then Cursor Legend.
You will see a new window. you can add cursors and then place them on the graph where ever you want.
Mark
-
I just wanted to see if anyone else on LAVA was attending the 2010 FIRST Robotics Competition next week. I'd love to get together with other folks and chat about mentoring over a coffee or beer.
Crystal
{Also hoping to see some temperatures above freezing and some ground cover other than snow for a few days}
Good luck to your team xtal.
What's your team's number and name?
Can you post links to your teams website or youtube videos?
-
hello Mark,
I would like to be more clear regarding that. for example, if we get pulse at 50seconds, the other pulse will be generated exactly at 100th second. So we need to take the mean of 0 to 49 seconds and then we should allow the peak and then again we need to take the mean from 51to 99.... this should be continued till the points end.
Great, now we are starting to get better information.
Here is version 2
The program will separate the high values from the low values.
values above the threshold input will be considered high and below will be low.
Only low values will be averaged high values will not be modified.
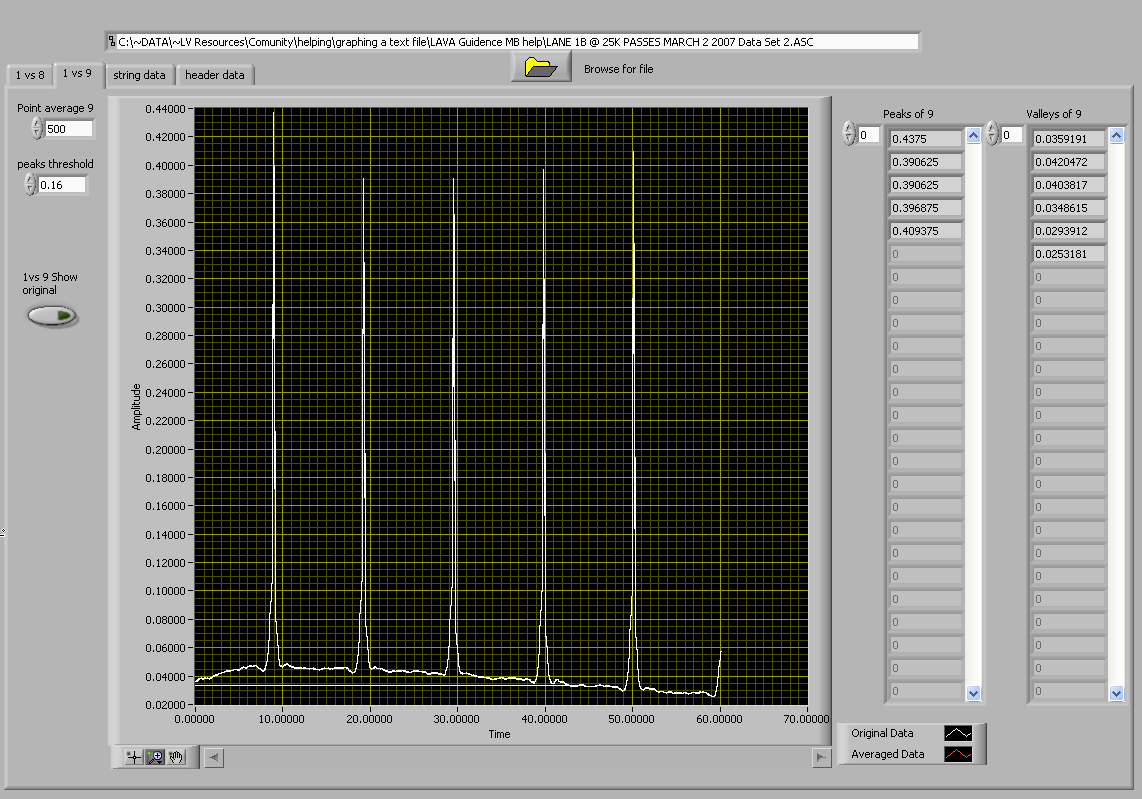
Here is the graph of the original waveform
And this is the new modified one.
Try this out and let me know.
Please give us as much detail as you can explaining any issues you still have
Mark.
-
 1
1
-
-
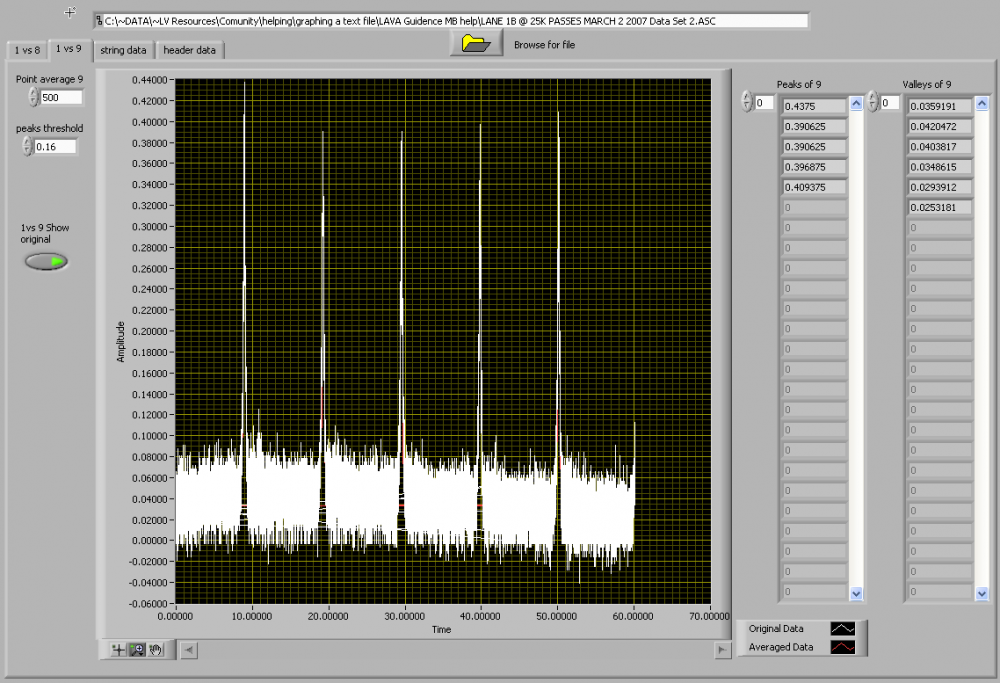
How do we know how many points to average at one time. do we average 5 or 50 or 5000?
The more points that we average the more the peak will be reduced in value.
Averaging 5 points will give a different peak value than averaging 50 points.

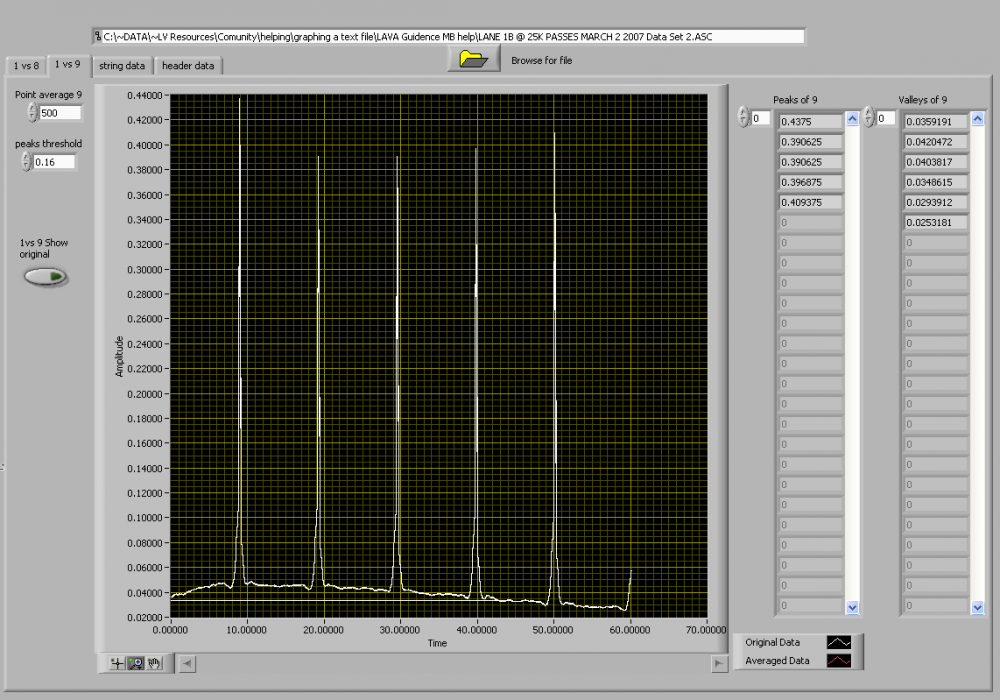
in the picture above the original waveform peak will be .431
if we average 50 points the peak will be .4016
How do you know which is correct?
Do you even need to do an average.
Can we just take the original and find the peaks of each pulse?
-
Hi,
It's fine....
But I have some doubts in that.. I told you that I need the actual peaks, in which we get them for same particular time period... and for the remaining base pulses, we need to take the mean of them. So It looks like ......./\...../\......./\.........
I think at this point we seem to be at a loss as to how to help you any further.
Can you please take the time and write out a detailed explanation of the project and what the ultimate goal is for the data will be.
Beacause of the language barrier you are going to have to be careful to define each item in detail.
Base pulses, actual peaks, particular time period, can mean many things to many people.
Here is a list that I need to help further.
- What is the final data going to be used for?
- What does the data represent?
- Why do you want to average / smooth the data?
- What does the peak and valley data tell you about the waveform?
- How do you know if the program is doing the right thing?
Please write as much detail as you can about your requirements so we can assist you further.
-
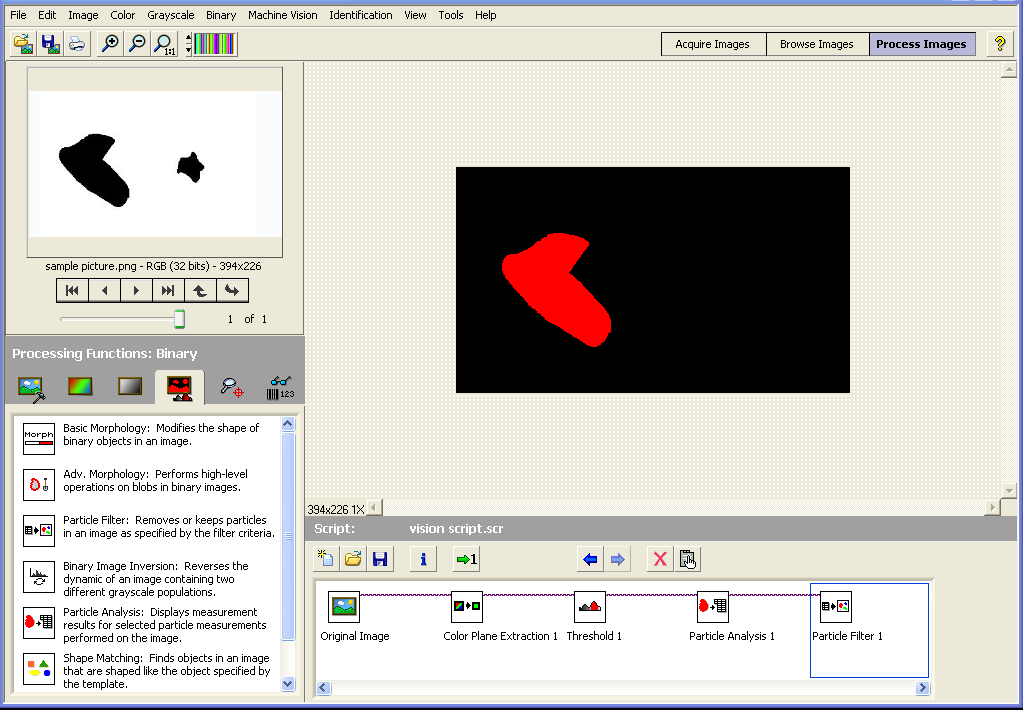
Now I'm using NI LabVIEW 8.5 with IMAQ Vision and a USB Camera.
I look for some method to detect a group of black color.
I can do a bit with the color detection, but
in this case how can I know which one have the black color,
which are grouping more than 50 pixels.
The function you are looking for is called "Particle Filter" but before you can use it you need to convert your image to binary.
The image below shows how it can be done in vision assistant.
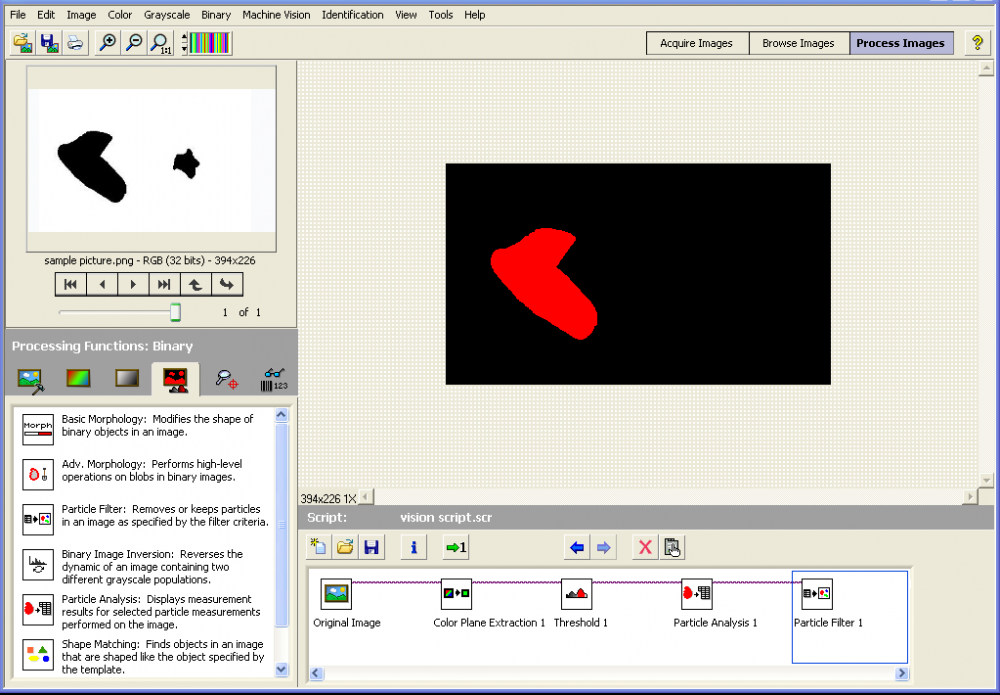
If the image is color you will have to extract a color plane then do a threshold.
Here is the script and the vi that vision assistant created for me
Good luck
-
All around, I can pay 100$ If the code reached my expectation or if it is half I will pay 50$. If you want First I can explain about that.
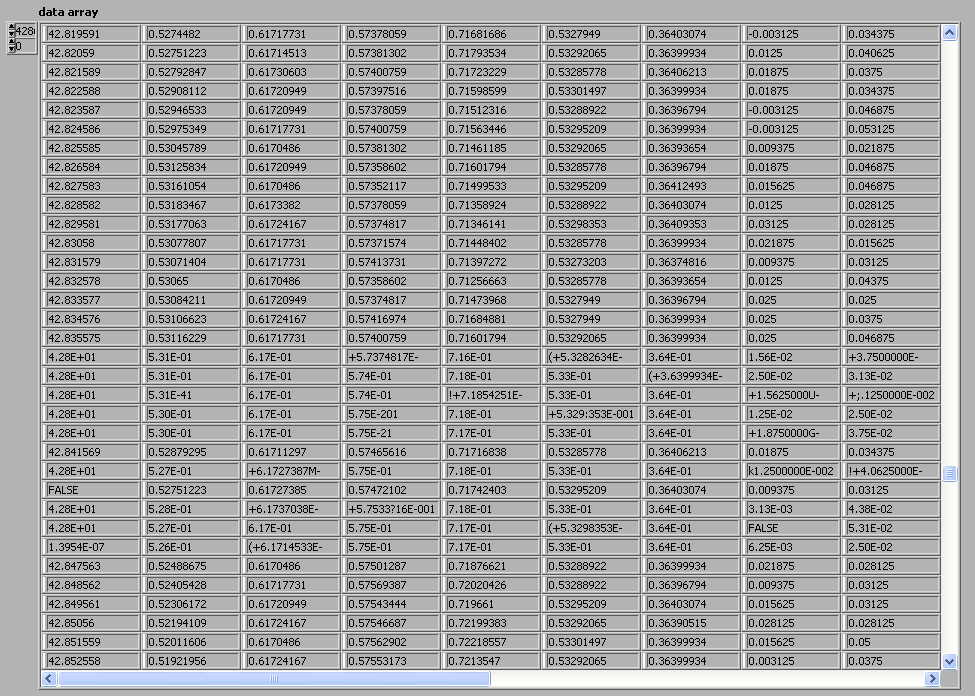
I have ASCII data in one file.
We need to use LABVIEW to read that data from 23rd row
and we should draw graph between
1st column and 8thcolumn,
1st column and 9th column.
The data presented in that file is practical.
So, by using mean function we need to get the smooth waveform
at the base and peaks should remain constant.
from that we need to find the number of peaks and valleys
in each waveform and should find the maximum and minimum value of each pulse.
Here I am sending the example ASCII data file and the code which I have written till now. Along with this I am sending the screen shot of the practical waveform. Please reply as early as possible after seeing this. Have a nice day.
Thanks and Regards,
Avinash Gogineni.
Based on your description here is what I came up with.
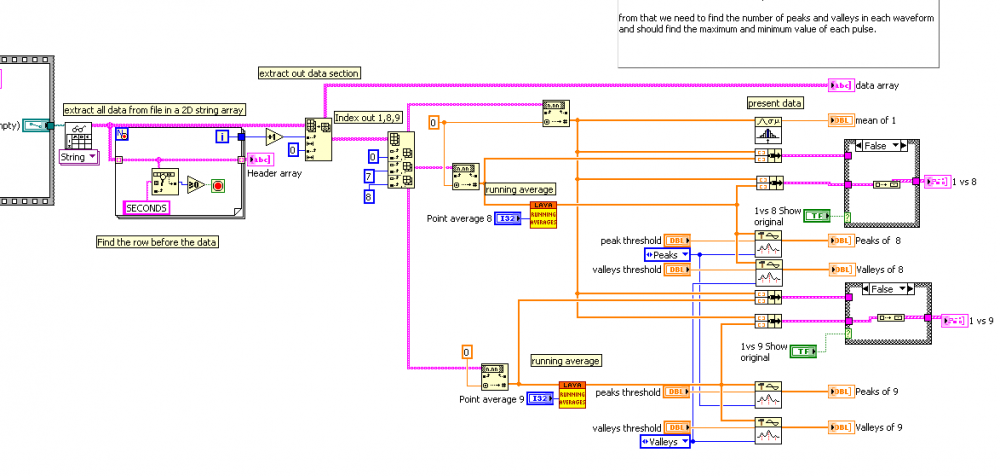
Hopefully this will get you further along than you were.
This program has the ability to change the number of points you average and allows you to see the original and averaged waveforms on the same graph.
As you can see below averaging 50 points reduces the amplitude of the peaks so you will need to figure out what the best settings are for your analysis.

The data in your ascii file is corrupt in 2 places shown below. This will cause odd behavior in your graph plots
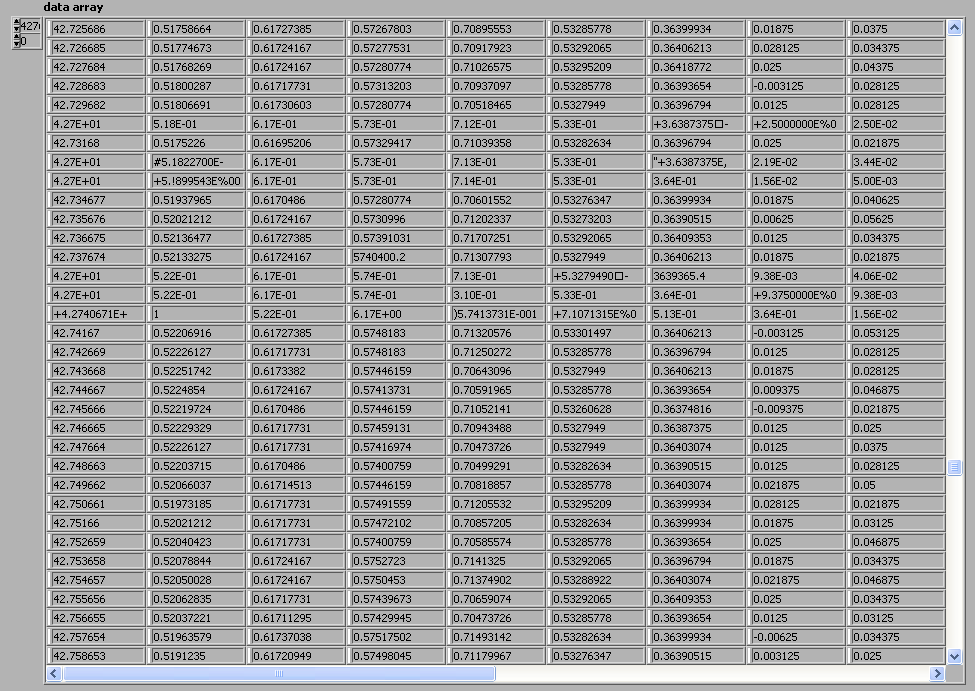

I hope this helps.
Finally here is the location to signup for LAVA Premium Membership
http://lavag.org/index.php?app=subscriptions
Let me know if you have any questions about the code or any problems becoming a Premium Member.
Mark
-
How about this. The members of LAVA help you with your LabVIEW program. If it works to your liking you take the money and become a Premier member and donate the rest to the LAVA fund?
How soon do you need this completed?
-
Approved 3-23-2010
-
Certified 3-15-2010
Placed in LabVIEW API>>JKI Right-Click Framework Plugins
-
- Popular Post
- Popular Post
1: Using the By Arrangement function
http://www.screencast.com/t/jrvrm5l1eu
2: Using Settingshttp://www.screencast.com/t/hU5E0eEI
3:Using Wire by Pairs function
http://www.screencast.com/t/4eUSYTMfc97-
3
-
Track mouse coordiantes and store in array.vi[]Hi,
I need to make a list(add into array) the mouse coordinates when I double click on the image. Please find the attached vi and suggest corrections.
Thanks.
I didn't have time to look at your code but the
"Draw Graph with Events.vi" found in the example finder sounds what you are looking for.
-
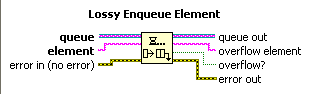
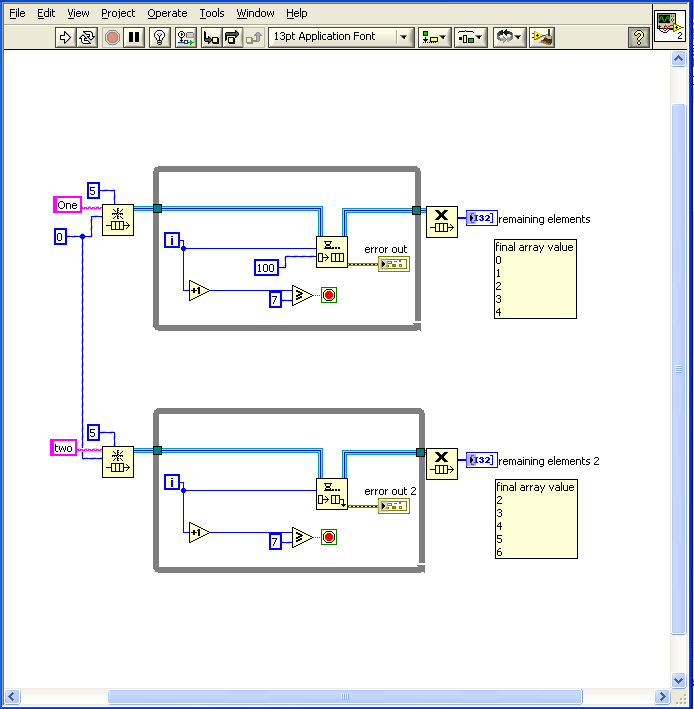
I haven't played with the lossy queues but what does the timeout do in that case. Will it wait that long before it queues the data and discards the oldest entry?
The Lossy enqueue has no timeout input.

-
Hey guys
Yeah I reached the conclusion that a 0 timeout on the enqueue is just gonna result in data not getting enqueued at all for that loop iteration, what I was wondering is what happens to that data?
Regards
Alex
To clarify the timeout is the amount of time the enqueue will wait for a spot to become open in the queue.
For queues that have no size limit it's value has no meaning.
a timeout of 0 simply means the node will not wait if the queue is full and will discard the input element.
Mark
-
Hey Mark
Thanks for your solution, I had a little trouble implementing it initially because I didn't put in the case structure, i.e. if no error -> do code, otherwise -> do nothing. As an aside, how much does having the error checking case slow the code down in your experience? Is an error signal a logic 1 or 0? If so I can't imagine it slowing things down too much, if it's a package containing error information with every check that might slow things down. Your thoughts? I ask because speed is crucial in the application I'm trying to create.
Kind Regards
Alex
Looking at your posted code the error checking case structure is insignificant compared to the other nodes. I doubt you could even measure the difference.
And another quick question about queues, if I tell something to enqueue as fast as possible (0 timeout) and my dequeing code can't possibly keep up, what happens to the data? Is it destroyed or lost somehow? Or does the code behave like a lossy enqueue rather than a normal one?
Regards
Alex
The obtain queue node has a max queue size input. If this is set to -1 the queue can be as big as your RAM will allow.
The data in the queue will only be lost if you release the queue before you dequeue all the items.
If you input a non negative number to the max size then you have two options.
If you use the normal enqueue and the queue is full the node will wait until it has timed out and then discard the input element.
If you use the lossy enqueue the node will push out the oldest element.

-
Hey everyone
I'm reaching the end of my tether with these while loops running in parallel. My program seems to run fine but then when I hit the stop button it just hangs and doesn't exit. Can someone tell me, or link me to an explanation of how to propagate a stop condition in producer consumer loops, in addition, how should I destroy the queues so that they are destroyed in the right order?
My code is attached if it's of any help at all.
Regards and thanks for your time.
Alex
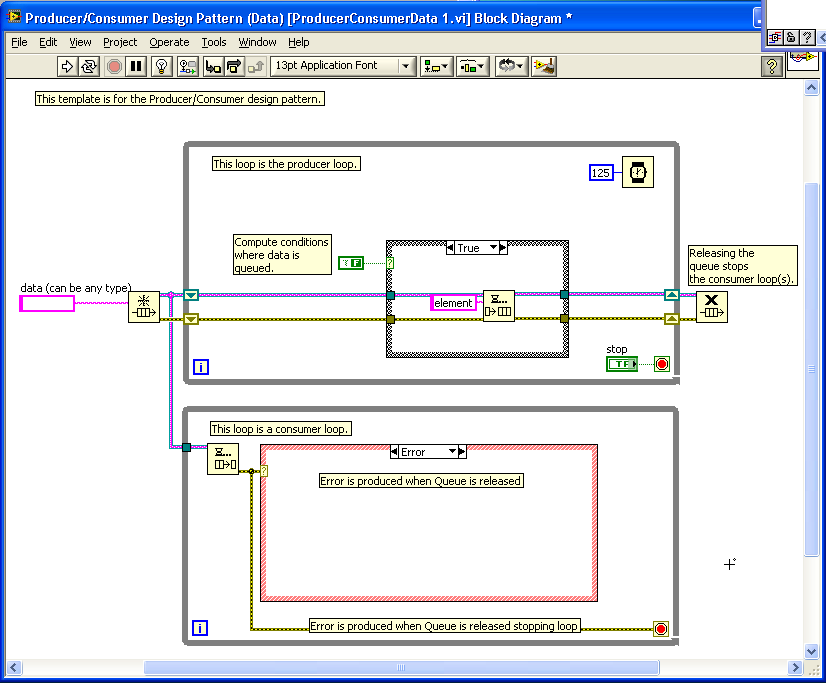
The problem is the timeout input on your dequeue node is set to -1 which means it will wait forever until there is an element to dequeue.
One of the primary rules of data flow is any structure (in this case a while loop) must wait until all items are complete before it can continue.
In your program the loop is waiting for the dequeue node to complete and the node is waiting for an element to be put in the queue.
The node will also release if the queue reference is destroyed.
So one solution would be to set the stop buttons and then destroy all of the queues.
This should release the dequeue node and let the while loop continue.
Closing the queue reference will also produce an error out of the dequeue node and many programmers wire the error out to the stop terminal of the while loop.
The Producer/Consumer Design Pattern (Data) uses this method.

Hope this helps
Mark
-
1
-
-
I have LV7.0 on Solaris 2.6 (yes, quite old), and I need a better icon editor than what is provided with LV. I noticed a couple of icon editors in the "approved code" section but they are for LV9. Any suggestions?
The ability to replace the NI editor with a custom one wasn't implemented until LV8.
I do have an Icon editor that will run in Windows with LV7.0.
It runs inside another shell vi called the (Subvi fixer)
I'll try and dig it up and post it but it may take me a day or so.
Mark
-
1
-
-
Personally, I can't stand using control labels to get a link to the control.
It creates a hidden link in the code which is impossible to find and very easy to break.
Here are some alternatives:
- You can find a very simple example here of how to bundle references into arrays which serve as groups. You can then act on these arrays as units. Each control can easily belong to more than one group.
Any time you place a reference inside FG you have a hidden link.
It looks like from the example they are only choosing to build the ref array differently.
Are you saying you need to have this big ugly bundling of control references on the main block diagram so you are not confused as to what controls get changed?
I find my name to reference method very easy to debug.
Any control that I want to hide or disable will use the top level vi and if there is a problem I go to that vi to fix it.
- Here you can find a JKI RCF plugin which will allow you to very easily create an array of references for any number of controls you select. You can then operate on these controls by index. This is better IMO than the label method because there's explicit code.
-
Here you can find another plugin which will allow you to easily create a typedef cluster of references. This is the one I like the most because the code is explicit, but as you mentioned, it has the downside of potentially taking up a lot of diagram space.

I like the tools but to me this gets a very low score on scalability.
With this method every time I want to add a new control to the group I have to
- create a reference
- then create a control to that reference
- then copy that control
- open the stub vi
- open the typedef in the control editor
- paste the control ref
- apply and save
- go back and bundle the control cluster.
- delete all the auto created code
- go though the block diagram and find every control in that group (if I can remember them all)
- select them
- run the tool
- reconnect all the broken wires.
And this is for every group I want to create.
Finally if one of the control refs that you are bundling refers to a typedef and the typedef is changed during development.
The reference in the stub vi will no longer match and your code will break.
Keeping controls refs and typedefs in sync is one of the biggest pains in LabVIEW.
So as I see it,
the difference between our approaches is
mine forces the programmer to be more disiplined with control naming but changing control groups seems eaiser.
and Yairs doesn't depend on any namming convention but more codding changes are involved to change the control groups.
Great discussion thanks Yair and dblk22vball
Anyone else have an opinion on this?
Mark
-
If I need to save controls settings that need to be recalled later I use the above methods.
But Usually I don't, and for large UIs that I need to guide the user through I will use the method below.
First I scan the Front panel and put all the control refs and label names in a Functional Global.
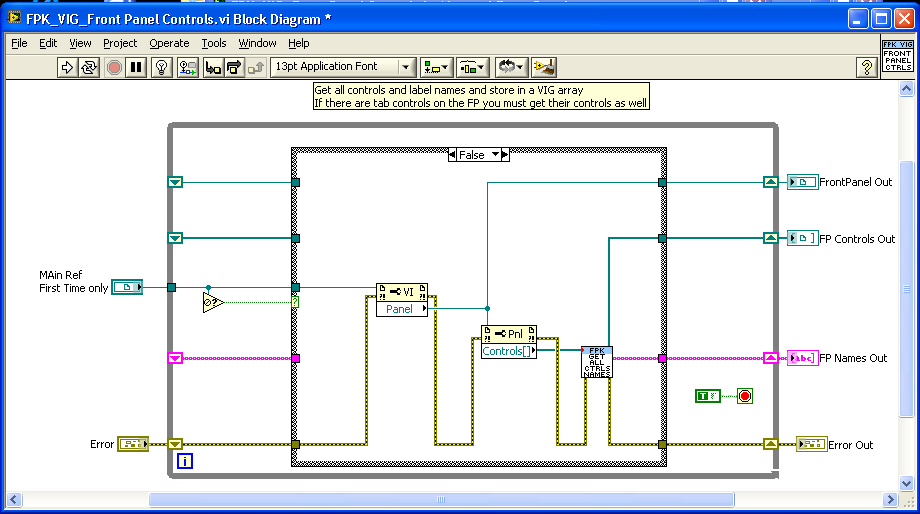
To set controls I create a list of control names.
Find the index of the name in the FG.
Using the indexes I build a list control refs.
Finally I send the reference array to a vi that changes the properties.
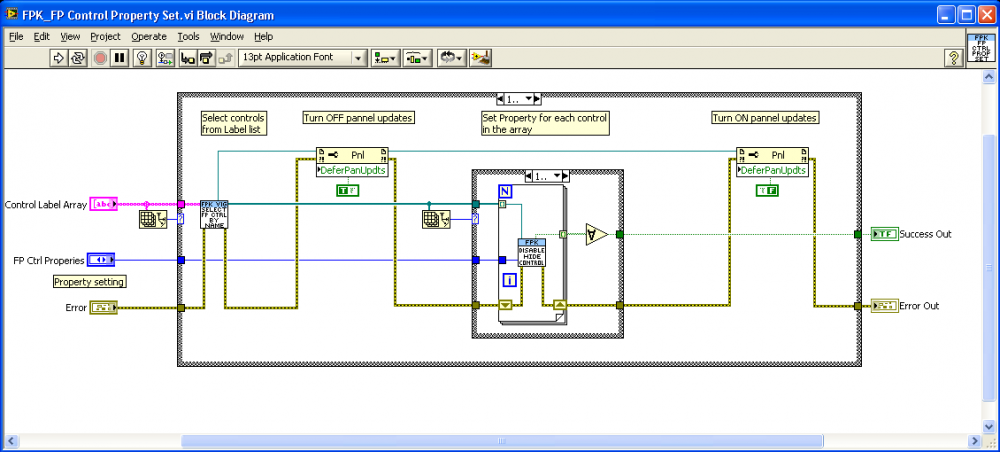
So really all I am doing is changing the properties of the controls by name.
What I like best about this method is it allows me to easily create groups of controls.
By using some creative naming schemes it is also easy to add and remove controls from groups without changing code.
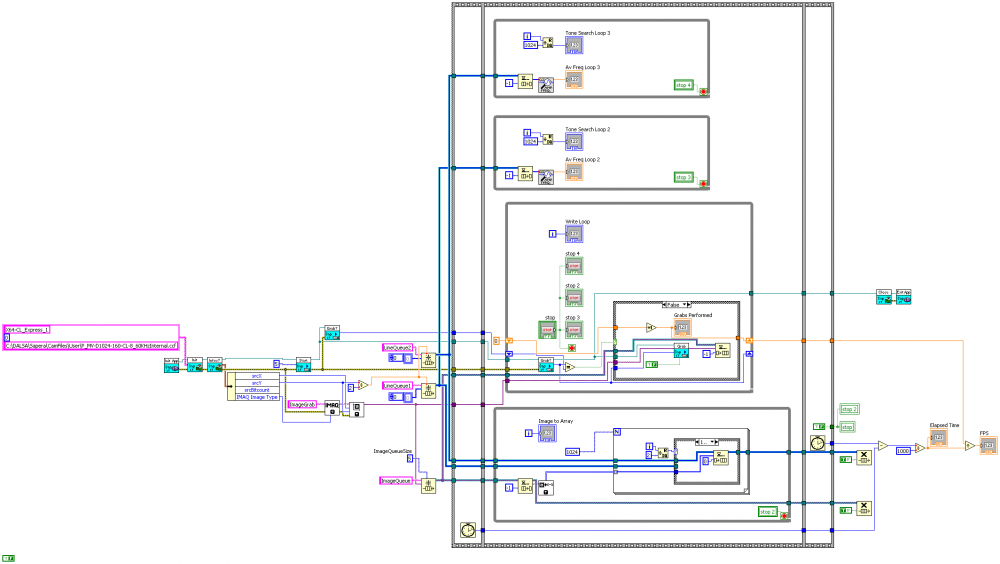
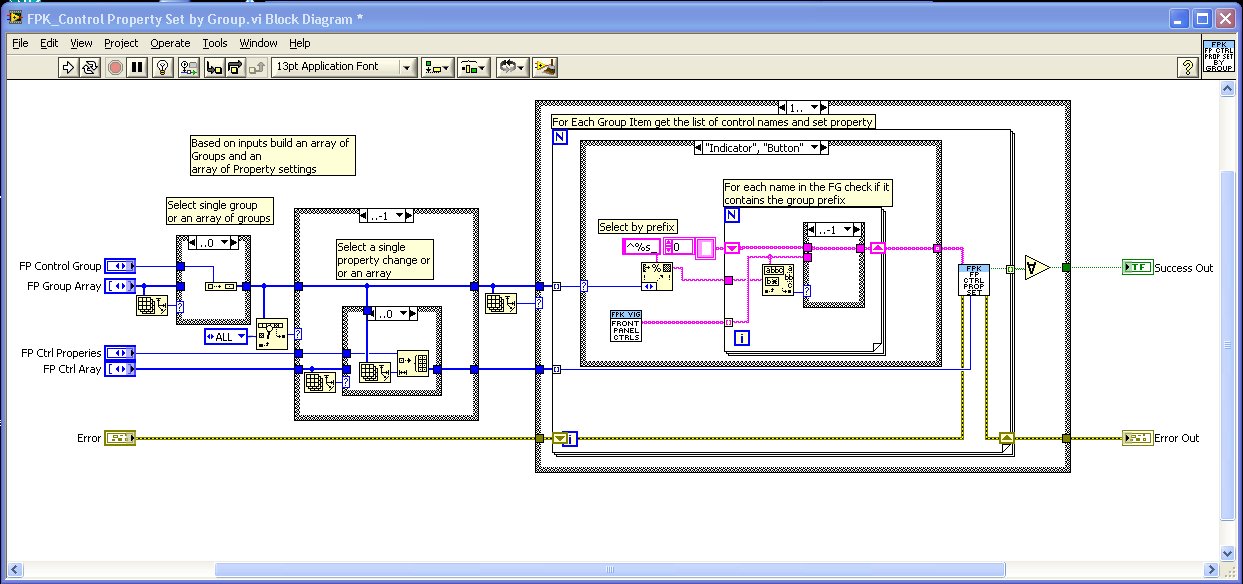
Below is the block diagram for the Top level vi
Inside the Indicator and Button case the code will scan the FP names for the correct prefix and then set the property.
Now If I want to add a button to the FP and want it to be part of the button group I just add Button_ as a prefix
The new control gets its property change at the correct time with no code changes.

If you use the search for prefix method remember to hide the label and show the caption on your Front panel controls.
Here is the code I hope this helps
By the way FPK stand for Front Panel Keeper
Mark
-
Certified 1-24-2010
Moved to LabVIEW IDE


[LVTN] LVOOP Assistant
in End User Support
Posted
Certified 5-4-2010
Placed in LabVIEW OOP Catagroy