

Mark Balla
-
Posts
607 -
Joined
-
Last visited
-
Days Won
41
Content Type
Profiles
Forums
Downloads
Gallery
Posts posted by Mark Balla
-
-
Certified 9-14-2010 \
Placed in Remote Control, Monitoring and the Internet
-
My turn.
I have not seen a nested event structure used before.
How does the event structure inside an event structure work?
When do you put an event in the the innermost one and when do you create one in the outermost?
MArk
-
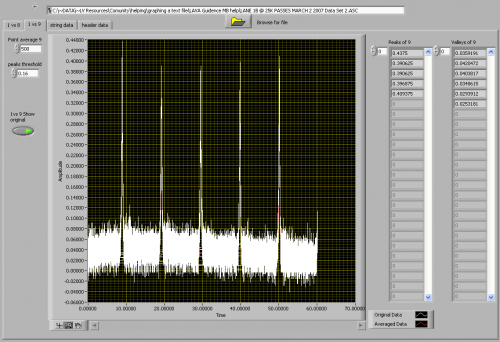
Here is the newest version.
I want to get the data manipulation right before we put this code in a state machine and make it pretty.
The new code has the following additions.
Threshold is calculated by adding 3 Standard Deviations to the mean. (Thanks ShaunR)
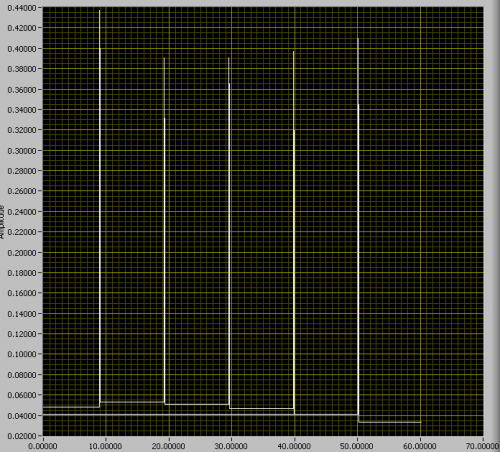
the threshold is then set and values above are not changed and values below are replaced with the mean value
to make values below the threshold look flat or "neat" all of these values are averaged and replaced with the mean value.
All corrupt rows with bad time data are stripped from the array.
Let me know if the data looks the way you want it.
Mark
-
Hello Mark, could you please attach this VI. So that I can check that one.
Here is the latest it only does the values below the threshold differently.
Please send me a data file with 6 peaks so I can continue with the rest of the code.
I will PM you with my email address if you can't post it here.
-
Certified 8-30-2010 placed in Remote Control, Monitoring and the Internet
-
Certified 8-30-2010 placed in Remote Control, Monitoring and the Internet
-

Avinashgogineni can you post the data file for this graph so I have it to work with?
Hello Mark,
We have to find 6 highest values. They should be considered as the 6 peak values. Mark, is there any possibility of using filter method to get the neat curve?
I still don't know exactly what a "neat curve" means.
It seems like you want a straight line for the data below the threshold.
So I will take all the data below the threshold and calculate its mean value
then replace each point with the mean value.
The result will look like this.
6 Sigma analysis.Anything greater than +- 3 standard deviations from the mean (or in this case +3 STD).
Works well for these waveforms.
Thanks ShaunR I'll use this method to set the threshold.
-
we should not change the threshold like that.
It should automatically grab the 6 highest peaks in the data and to indicate them here.
we have to delete that threshold settings. I am attaching the code here.
Is 6 peaks always the correct answer?
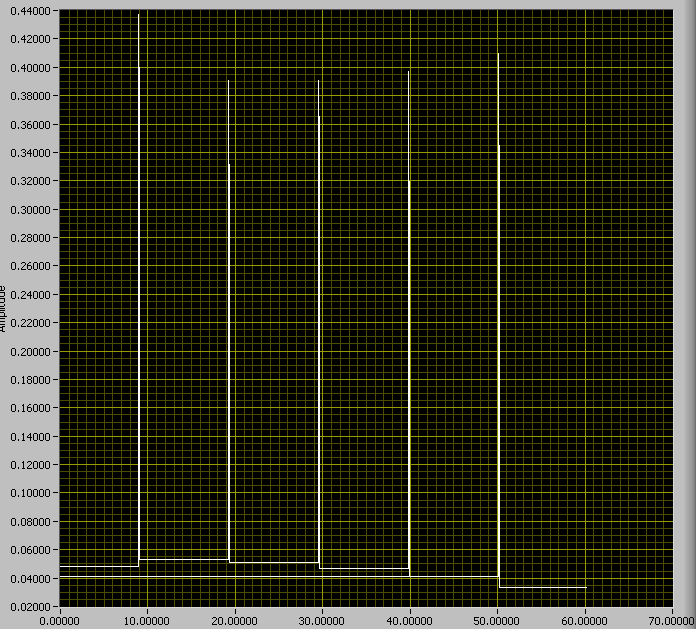
The original data that you sent me only had 5 relative large peaks.
The threshold was designed to separate desired peaks from noise.
I look for 20 points above the threshold.
If I get 20 or more points above the threshold then it is defined as a spike.
If this doesn't work for you then you need to explain a better method.

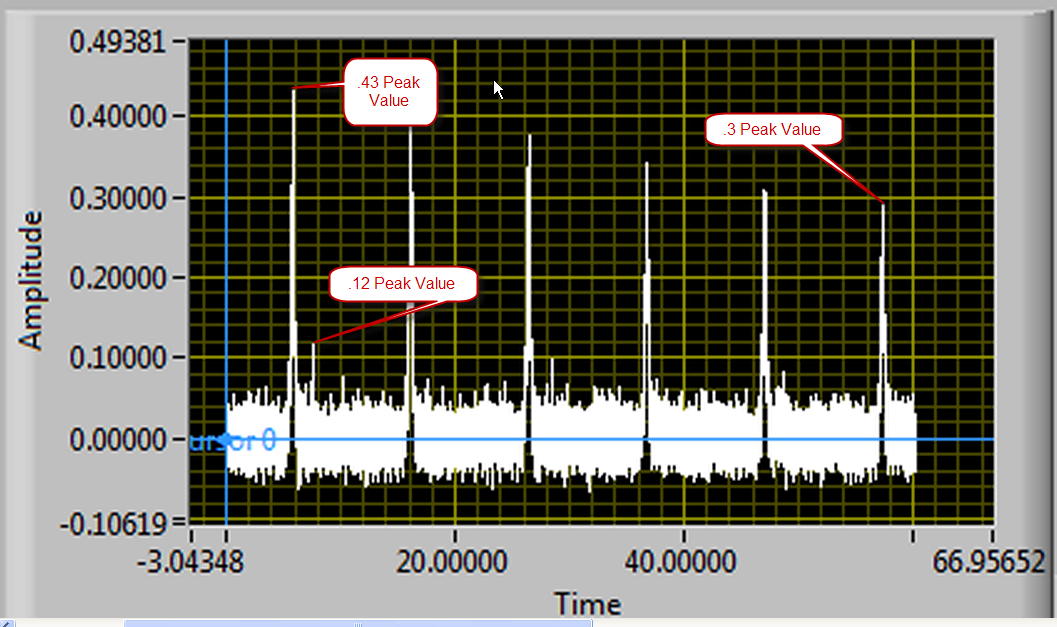
In the picture above we need to separate the noise spikes from the actual spikes.
as you can see there is only a .13 difference between the highest and lowest spike
and there is a .18 value difference between a noise spike and the lowest actual spike.
Anyone out there have a better way of separating the noise from the spikes?
-
From the picture it looks like the peak threshold value is only recorded above .3. I don'thave access to the code right now but I think there is a threshold setting in the program that you can lower.
-
This has become an exercise in social engineering and language, very interesting.
Mark posted the questions below in the thread quoted above, have these been addressed?
What is the final data going to be used for? No discussion of the purpose of the result
What does the data represent? No discussion of the real implications of the input data.
Why do you want to average / smooth the data? No discussion.
What does the peak and valley data tell you about the waveform? No discussion.
How do you know if the program is doing the right thing? No discussion.
Those questions are reasonable in the absence of a clear description of program goals.
I imagine they are hard to answer if either the language gulf is too great, or the questioner has no clear idea of the desired results.
When trying to solve a problem for a client who has no idea how to solve it, it is possible to provide good solutions, IF a basic understanding of the higher level needs are understood by both parties. That is why the questions above are so important. AND, if either party is unable to answer those questions, then a successful solution is unlikely. Seems hopeless so far.
There is one final item - that of premium membership. It still has not happened.
thanks for chiming in. I don't feel so alone now and I am glad I kept this discussion public so others can follow.
I did check with Michael and it looks like the Premium membership is valid it just seems to be taking a while to transfer the funds.
Avinashgogineni,
as mross has pointed out it would be a much easier for me and others to help you if you could answer the above questions.
Hello mark,
I am attaching two files here the file post processing is the one which you have done earlier.
and the other one is main.vi, it is the same but it is done is VI manager.
I want to read the data from ASCII file.
The ASCII file is having 60000 rows and 9 columns.
Among them we have to read the data from that ASCII file and we need to draw graph between 1st column and 8th column, and
the second graph is between 1st column and 9th column.
We have some junk data indicating the description,
dates of the project. we should not read them and if we try to draw the graph between those columns,
we wont get the uniform curve. So,
we have to make it uniform by using any kind of techniques and
the main important thing is that we should not disturb the peaks.
The peaks in the graph should remain same before and after the modification.
I am trying to load the ASCII files.
I tried in different ways to upload .zip files too.
If you want an example you can see some ASCII files in the below link.
The curve should be like this
.................../\........................./\................................/\................................../\............................../\.................................../\..............................
The curve should be neat. and it should indicate the peak values of the raw data and the peak values of the uniform wave.
Ok as far as I can tell the current software does all of this.
DO you agree that the software I wrote for you before does all the items above?
They should coincide each other.
I don't understand what you mean by "coincide"
we should get the base line measurements too of each cycle.
Please explain more what you mean by base line measurements
Here in this VI we have an option to open the ASCII file from the section like "BROWSE THE ASCII FILE"
WE should not use those kind of things.
we have to browse the file from the option menu FILE --> OPEN and then start RUN.
OK so you would like a pull down menu I will add this to your main
After getting the Uniform curve and values,
What does a uniform curve look like or
how will we know what a uniform curve is.
What do we do if a curve is not uniform?
we should get them in the separate Excel sheet indicating the project details
you will need to create an example excel sheet and how you want it formated. I'm not going to guess at this.
( as I mentioned it as junk data before).
Junk data will be left out of the excel sheet.
If you have any doubts. please ask me.
Please answer all the questions with as much detail as you can.
Mark
-
Hello Mark I am a premium member in LAVA. I feel happy to be here with the talented guys and I really need your help to complete my project as soon as possible. please help me in that.
Thats great to hear.
If the premium membership came through you should have a banner below your name similar to mine.
I'm checking with admin to see if this can be fixed.
Please start by posting the current code you are using.
Next create a list of the top 3 things you want to add or change.
Please try to write as much detail as possible.
Then we can discuss further.
Mark
-
 1
1
-
-
Its been said a lot but it can't be said enough. Thankyou for being a part of the LAVA community.
Most all have learned something from you over the years. I can think of several times when your post or presentations have made me change how I think about LabVIEW.
My hope is that someday you can program in LabVIEW more than you do in C.
Looking forward to another 10 years
Mark
-
Certified 8-18-2010 and placed in Right-Click Frame work Category
-
A Q's LabVIEW Songs at the Bar B Queue can be found here
-
Since the majority of LAVA members can't go to NI week I thought I would start this topic so those that did go can share some of the things they learned and experienced at NI week.
If you have pictures, links or information that you got from NI week please share them for all to see.
I have several things to share and I will be posting the AQ (Classes State of the art) video as soon as soon as I can figure out how to get it out of my Droid X.
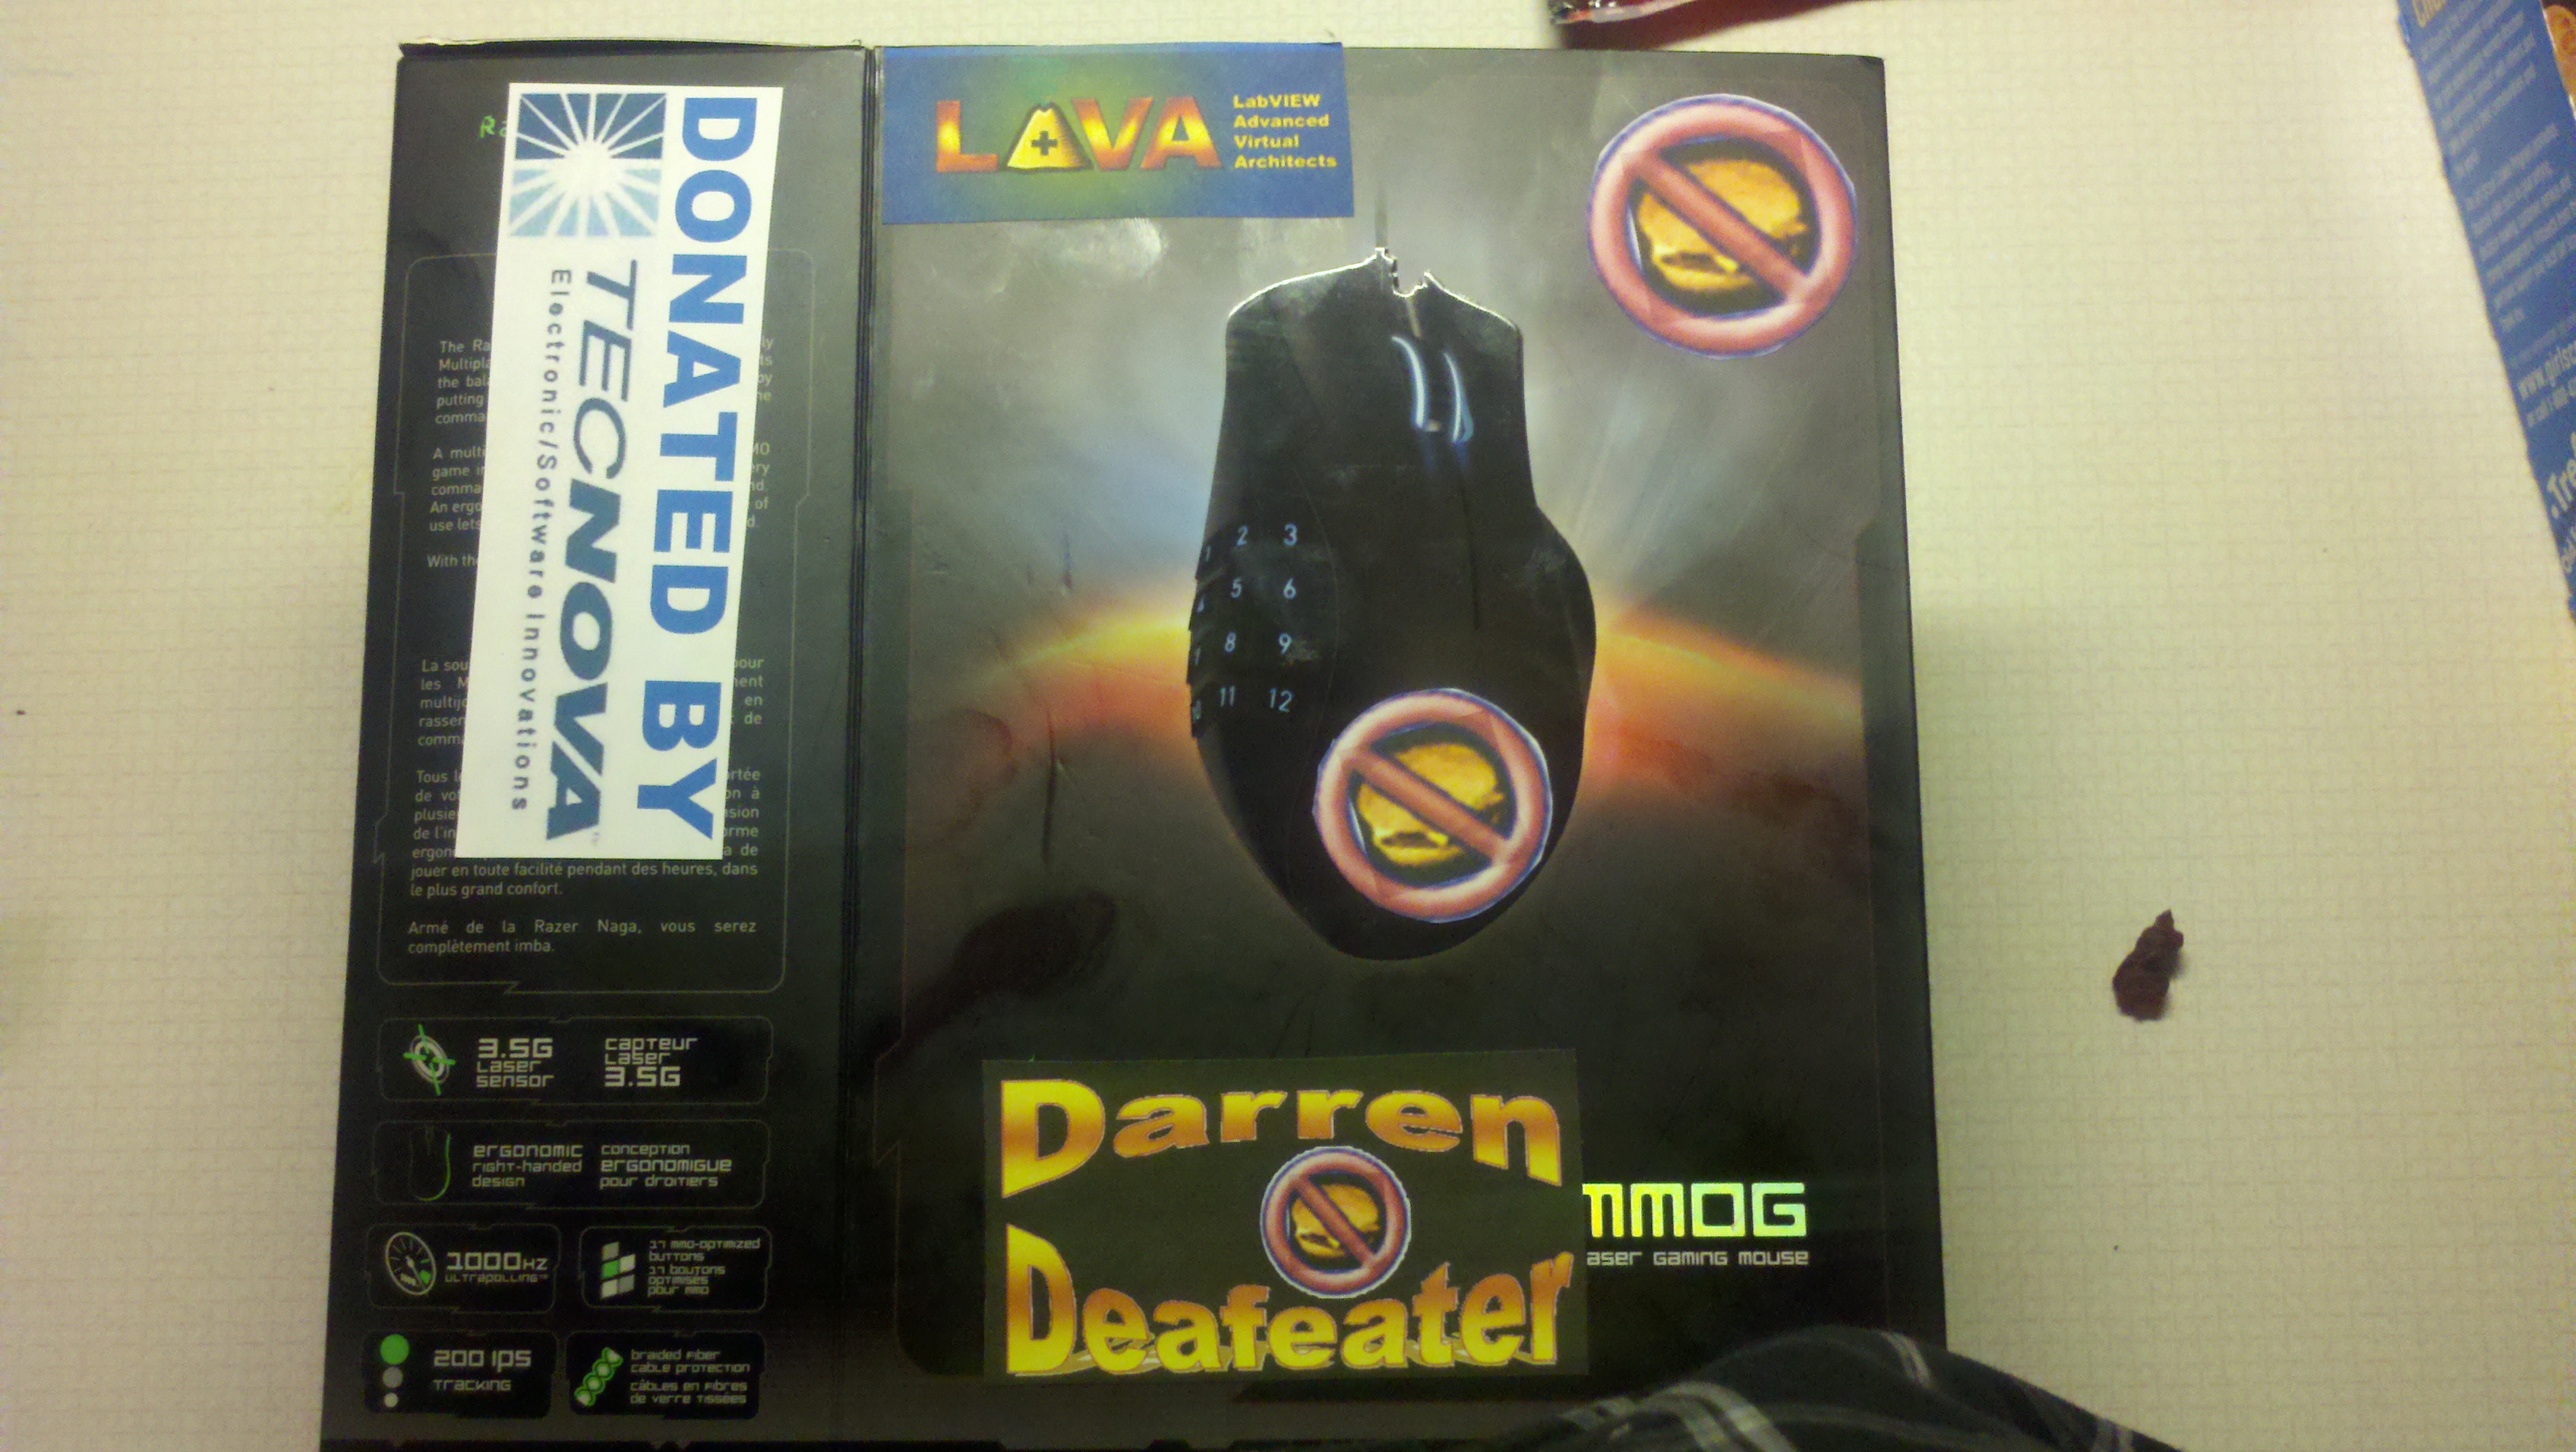
One of the things that sticks out in my mind is during the LAVA Bar B Queue my company donated a gaming mouse to the raffle which I put some stickers on and named it the (Darren Defeater) see image.
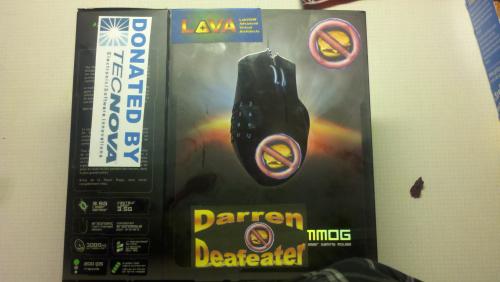
The idea was that it was something that could help speedup LV programming enough to defeat Darren (the LabVIEW Artisan) in the coding challenge.
As it turned out the person that won the prize gave it to Robert the person that actually competed against Darren. He lost of course but seeing my idea come to light made my day. See here for details
-
The Bar-B-Queue was a blast this year.
Great job Justin, crelf, A-Q, Norm.
Can someone post AQ's music sheet so all the LAVA members can see it.
I can't seem to find mine.
-
I want to handle the "Direction Change" event simply by changing the numeric controls to indicators (or vice versa).
If that approach is a dead end, what other technique is available to accomplish the same thing?
Thanks,
Mark Zvilius
It might help to not think in terms of indicators and controls.
I know this idea has been drilled into our heads since we first started working in LabVIEW but X-controls are a different animal.
Instead try and think of an X-control items as having 4 states
- Development time Input mode
- Development time Output mode
- Runtime Input mode
- Runtime Output mode
The Facade defines how the x-control with look and act for each state.
If we use a numeric control as an example
- Increment arrows shown, White background, Data entry allowed
- No increment arrows, Gray background, Data entry allowed
- Increment arrows shown, White background, Data entry allowed
- No increment arrows, Gray background, Data entry not allowed
So instead of trying to force the numeric controls by hiding and showing them I would instead change a numeric control's properties depending on its current state.
- Show arrows, Color background white, Enable
- Hide arrows, color background gray, Enable
- Show arrows, Color background white, Enable
- Hide arrows, color background gray, Disable
I have found this way of approaching X-control design much less aggravating.
Mark
-
1
-
As I have stated for all to read I go to NI Week to meet other LabVIEW developers.
So if you are coming to the big show let us know where are you staying, what you will be doing, and what you look like.
I have created a MAP that will help new comers navigate Austin.
I'm Staying at the Hilton.
Sunday: Get in at 4:00pm
Ginger Man and ?? (No roller girl bouts scheduled this week but Norm will think of something)
Monday:
Alliance day
Tuesday
Lava Bar B Queue
Wednesday
NI Party
Thursday:
??
Here is what I look like (I will be wearing a Tecnova shirt or LAVA Tshirt)
If you see me please come say HI but be prepared to talk shop or play fooseball (I need a partner to take on JKI).

-
Hi there,
thanks for your suggestions.
a more complex project is really appreciated...

thanks
The project can be as complex as you want it to be.
- Make the button cluster as an X-control
- Have the random number generator only create prime numbers
- if a user takes more than 1.5 seconds to press the next button then fail the test.
- Make the buttons alpha numeric.
You've been given 3 good Ideas already so you will need to give us more information before we can help you further.
-
Mark,
Starting to practice for the CLD and thought I would try your number tester.
Any feedback would be greatly appreciated!
Thanks,
Geoff
HI Geoff,
As far as evaluating it for the CLD he is my take.
Functionality:
Great no issues
Style:
Looks Good
I would recommend you bundle your data (except the state data) in a single cluster as the Shift Register data. Then unbundled and bundle the data you need in each case. This makes the code more scalable and cleaner.
In a few places there are unnecessary bends in wires. (One of the guys I work with lost points because of this)
The main program has a default icon.
Documentation
Needs more comment documentation inside the code. Only documenting the subvis isn't usually enough to get full credit.
The buttons need tip strips. Last I knew they want to see tips strips on all the controls on the Front panel.
The number one problem that most everyone has when taking the CLD is running out of time.
I would recommend you practice your speed programming as well as the items above.
If you use Quick drop and a frame work similar to the JKI state machine you should easily be able to build up a flexible state machine in 20 minutes or less.
I would like to hear other members take on this also.
Good luck on the CLD
let us know how it turns out
Mark
-
- Popular Post
- Popular Post
My story made NI'sInstrumentation Newsletter Q2 2010
See page 24
-
5
-
Hi all,
i am beginner in labview. Can anyone help me byy giving a labview project for my assignment as a part of the course i am doing...
Somebody plzzzzzzz helpppppp.....
How about this? Create a basic number tester.
<object id="scPlayer" width="718" height="457"> <param name="movie" value="http://content.screencast.com/users/mballa/folders/Jing/media/6b5494b7-6ddd-49af-b16d-39be72d51226/jingswfplayer.swf"></param>'>http://content.screencast.com/users/mballa/folders/Jing/media/6b5494b7-6ddd-49af-b16d-39be72d51226/jingswfplayer.swf"></param> <param name="quality" value="high"></param> <param name="bgcolor" value="#FFFFFF"></param> <param name="flashVars" value="thumb=http://content.screencast.com/users/mballa/folders/Jing/media/6b5494b7-6ddd-49af-b16d-39be72d51226/FirstFrame.jpg&containerwidth=718&containerheight=457&content=http://content.screencast.com/users/mballa/folders/Jing/media/6b5494b7-6ddd-49af-b16d-39be72d51226/2010-05-25_0704.swf"></param> <param name="allowFullScreen" value="true"></param> <param name="scale" value="showall"></param> <param name="allowScriptAccess" value="always"></param> <param name="base" value="http://content.screencast.com/users/mballa/folders/Jing/media/6b5494b7-6ddd-49af-b16d-39be72d51226/"></param>'>http://content.screencast.com/users/mballa/folders/Jing/media/6b5494b7-6ddd-49af-b16d-39be72d51226/"></param> <embed src="http://content.screencast.com/users/mballa/folders/Jing/media/6b5494b7-6ddd-49af-b16d-39be72d51226/jingswfplayer.swf" quality="high" bgcolor="#FFFFFF" width="718" height="457" type="application/x-shockwave-flash" allowScriptAccess="always" flashVars="thumb=http://content.screencast.com/users/mballa/folders/Jing/media/6b5494b7-6ddd-49af-b16d-39be72d51226/FirstFrame.jpg&containerwidth=718&containerheight=457&content=http://content.screencast.com/users/mballa/folders/Jing/media/6b5494b7-6ddd-49af-b16d-39be72d51226/2010-05-25_0704.swf" allowFullScreen="true" base="http://content.screencast.com/users/mballa/folders/Jing/media/6b5494b7-6ddd-49af-b16d-39be72d51226/" scale="showall"></embed> </object>
This is a test I used to give potential employees. Its around a CLAD level program.
Hope this helps.
Mark
-
Due to the new forum upgrades the requirements for the LAVA CR have been updated.
-
Thanks for your time Mark.
Would it be a better suited located in the new Quick Drop Plugins category (under LabVIEW IDE)??
What are your thoughts?
Cheers
-JG
I moved it to the Quick Drop Plugins category as requested.
Mark
-
1
-


[CR] Windows API
in Code Repository (Certified)
Posted
Certified 9-15-2010
Placed in General Category.