

Antoine Chalons
-
Posts
957 -
Joined
-
Last visited
-
Days Won
34
Content Type
Profiles
Forums
Downloads
Gallery
Posts posted by Antoine Chalons
-
-
Hi,
I have IMAQ 4.5 and here's what I can do. Not sure which version of IMAQ introduced the grey U16...
[screenshot won't upload
 , probably related to that, anyway it works fine for me with IMAQ 4.5]
If you just need to extract a color pane top display it and don't need to have a greyscale u16 to do processing on it then you can create a second RGB U64 and use the "color image to array" function and extract only the red pand from the 2D array (by replacing the other panes with 0). Just an idea...
hope this helps
-
Here is a simple modicifation of the VI you posted on the first thread.
I used another VI for the rake, I think it's easier to use.
Hope this helps
-
Hi,
Since you didn't answer back on this thread I thought you found out how to do it.
Are you still at the same point or do you go any further?
You're not far from the solution, with you inner and outer circles you can define an annulus and then use the Annulus to ROI vi to then use the rake.
Do you need an example?
-
When a subVI needs to create an error to return to caller, how do you typically set the values of the error cluster (you may check multiple)?
Other: I typically I use the Build Error Cluster__ogtk.vi along with the Error Codes Ring constant__ogtk.vi.
Same for me.
-
Hello,
Your attempt is not bad.
My suggestion would be that you use the function "ROI to Annulus" with the first 2 ROIs you define, then combine the these 2 annulus into one and then use the "Annulus to ROI" so you can perform the rake.
Secondary question, have you used VBAI as a starting point? If yes I could send you an example inspection with images that might help you.
Hope this helps
-
Ok, thank for the explanations, I was hopping to find a way to spare myself upgrading my project to 8.6, but as you said, I'll have to chose between that and not using the feature.
-
Can't help with the problem. But maybe can explain how it is different
It is a "plug-in" control and resides in the "\resource\PlugInControls" directory. As far as I'm aware, it is an undocumented interface allowing controls to be created from external DLLs and resources. I have a feeling it was the way NI was going for custom controls before they decided on Xcontrols.
Yes, I saw Rolf's post that's about the same subject.
I'm not sure what all this implies.
Now the point is that in LV 8.6 I can pass the ref of an image display indicator and so edit it from another VI and in LV 8.5 I can't

-
Men... we struggle here each time we try to hire a new LabVIEW developer...
The situation here (Switzerland) is weird, the economy is pretty active and rather stable, but there is a huge lack of engineers. We are 6 developers here, only one is Swiss (2 french, 1 german, 1 italian), this shows how Switzerland is hiring its engineers from the countries around I think.
At NIDays in Zurich last week there was a stage discussion and NI's branch manager was pointing out this issue for Switzerland.
-
Hi,
I haven't dug into it but I'm pretty confident you can find a lot of inspiration in this example : http://decibel.ni.com/content/docs/DOC-15359
Hope this will be of interest
-
Hi all,
The image display indicator is giving hard time (in LV 8.5), on the block diagram, I create a reference to my image display indicator and then try to create a control form the reference... it doesn't work, no error shows up, it's just like LabVIEW ignores the action.
After digging a bit I saw that if I just open LabVIEW, create a new VI, place a generic control ref constant on the diagram and try to select "ImageControl" class, it's not possible because it's not in the list. Then if I place a image display control on the front panel, the "imageControl" item appears in the selectable class list under "control" but at the end - not alphabetically sorted.
That leads me to think that this control is somewhat a bit special in LabVIEW.
Anyone can explain that to me?
[EDIT]
Ha!
Even more interesting... I could create an Image Control ref terminal using scripting in LV 8.5 but the VI that contains it will always have a broken arrow (because the VI cannot be compiled) and most the time I would have a LV crash when trying to save the VI.
BUT, after LV 8.5 crashes if I open the VI in LV8.6, the VI will work fine. Trying to save for previous version that VI from LV 8.6 will lead to a crash...
So I have a solution for 8.6 but not for 8.5...
Anyone can help?
PS: here is the trick to create the image control ref terminal in 8.5.
-
Hello all,
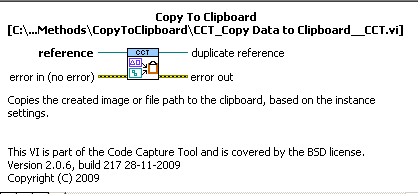
I am using the 'Get Image' method of a graph control to get the image data. I'd then like to use the Clipboard.Write method to copy the image to the clipboard. Does anyone know how to do this please?
I know the control has the 'Export Image' method but the results are not great with this function.
Thank you,
Martin
There is a way I think, you should have a look at the CCT, it has a function to put data into windows' clipboard.
-
OpenG is still suffering from a lot of spam
-
Hi All,
I would like to capture video (30Hz, 24bit color, 640x480) in sync with some DAQmx channels.
The data needs to be streamed to disk and retrieved back to display in realtime with data.
My question is what hardware is recommended to support the video portion of the system.
I am planning on a cameralink interface that has hardware triggering but am not sure if I will need any special RAID hardware
for the streaming to disk. Also what is the most efficient format to use:
IMAQ->AVI->Disk
IMAQ->JPEG->Disk
IMAQ->(Some other GPU compression)->Disk
IMAQ->Array->TDMS
I am not really going to processes the video so would it be possible to use some 3rd party activex controls that are optimized for GPU video streaming?
Hi,
That's about 26Mbyte/s that you have to save to disk, what's the maximum duration? Maybe you could avoid the RAID and just have a good SSD (the Crucial C300 256Go is a pretty nice product!).
A few years ago I made a small streaming system with a non-triggered Basler Camera - A2xx I think - 60fps, 8bit, don't remember the frame size. At the time the most efficient method I found was IMAQ > BMP > Disk and wait till the acquisition ends to generate the AVI file.
SDDs didn't exist nor NI streaming hardware so we just got an HP workstation with a built-in RAID, it worked just fine.
Also, in April 2007 I made a compression filter benchmark - in french, but that might help anyway.
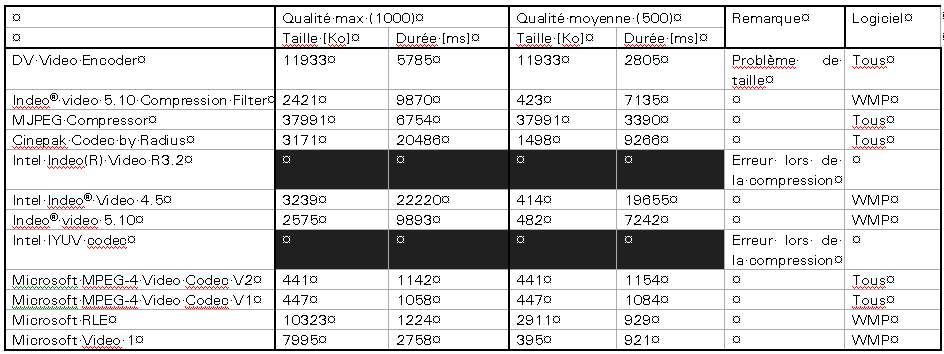
hope this helps
-
@Antoine: Why dont you work with Saphir? As it is one of the first LabVIEW integrator in France...
I did work a there a bit during summer break when I was a student... but my mum and my dad both work at Saphir... That's a good enough reason to me.
Yes, Saphir was the first NI Alliance Member in France, but Qualimatest has been an NI Select Integrator (the level above) since 2001 (maybe the first in Europe?) so it's a nice company as well.
And there is a big lake in Geneva, you don't get that near Saphir.
And being in Switzerland (where rugby is not popular at all, and totally amateur) I get to play in the top national league and some of my team-mates play for the Swiss national team, in France (where rugby is a professional sport) I would play in 10th division. Maybe...
-
I feel lucky, I didn't have to look very far for a mentor :-o
-
Hello,
It's possible, do things in that order :
1. set the graph property "Y Scale.Uniform Marker Spacing?" to false
2. set the graph property "Y Scale.Range.Maximum" to 65
3. set the graph property "Y Scale.Range.Minimum" to 1
4. set the graph property "Y Scale.Marker Values[]" to an array of DBL [1;2;64;65]
Hope this helps
-
has anyone tried (developped???) the iPhone app "VIremote"?
is it good?
-
hi,if cannot use dll.how can i do?
The answer will probably depend on why can you not use dll?
I don't know how to do it in non-windows OS and if you are in Windows then I don't know how else you can do it...
-
hello,
how to move mouse in LabVIEW ?(you cannot call the api).
thanks

Hi,
If you're running on Windows you can use the function "SetCursorPos" of the User32.dll.
Si VI attached in LV 86
-
Oh well... I didn't know it would work for a mixed selection of free text and control labels...

It is also true that I tend to jump on scripting a little bit too much these days. BUT for a very large number of label to resize and a large number of VIs to perform that task on it would save time

-
My project is getting rather big, the the function block busy...especially with nearly all wires clearly labled.
It'd be a pain to downsize every label, one by one. Be nice if I could reduce the font size of ALL labels in one fell swoop. Any way to do that?
Nothing is easier than using vugie's scripting sandbox for that, you'd need to have the LabVIEW API installed though (and to know a bit about scriptng of course).
That said, I'm not sure reducing font size is the best option, maybe creating some subVIs along with a different architecture would be better.
Can you post a screen shot of your man VI so we can help you in a meaningful way?
-
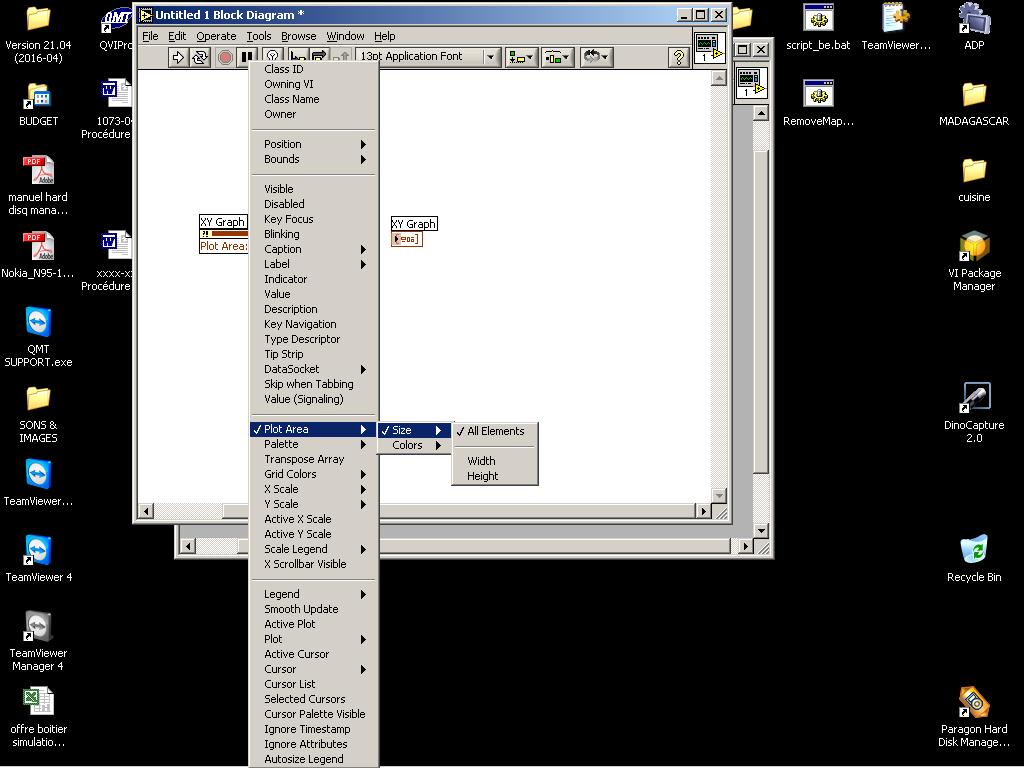
LabVIEW Ver 7.1 does not have the option of Plot Area Position.
I couldn't check because I don't have LV 7.1 installed at the moment but I'm sure that at least you have it for XY Graph, not sure for Waveform Chart...
To check, create a property node on you chart and see at the same path here :
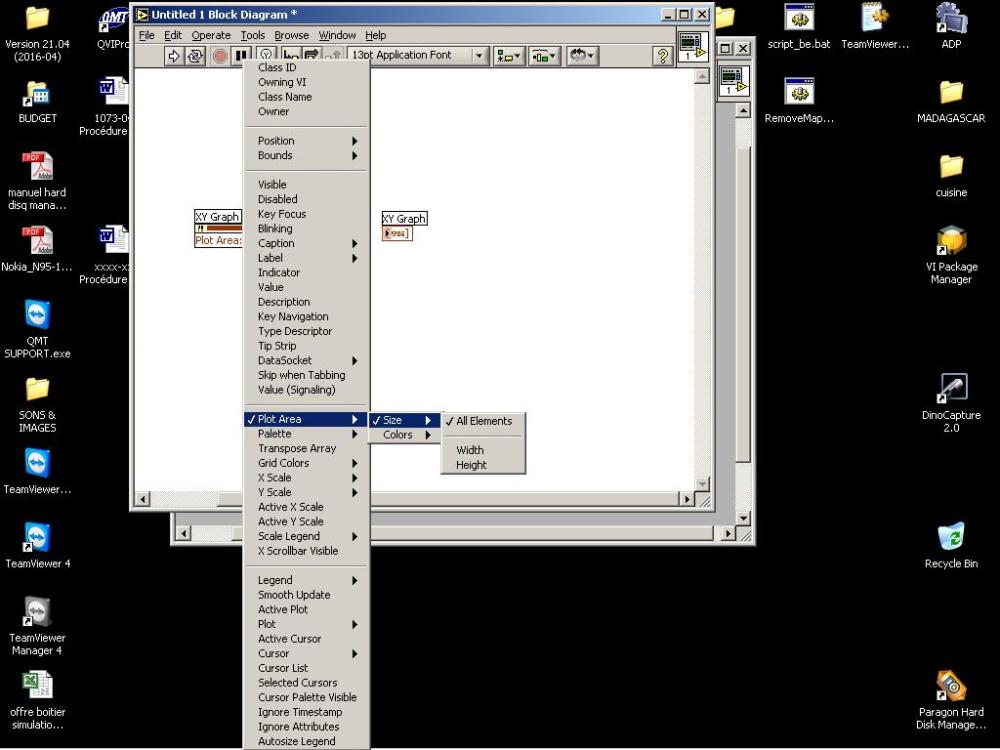
Hope this helps
-
Hello Friends,
I am using Waveform Chart with multiple Y axis scales. Currently 6 Scales are used and made visible programatically. The Default No of scale is 6.
Now the question is, sometimes when I change the No of scales from minimum to maximum, the scales are overlapped on the plot area. Please see to the attachment.
How to solve this issue.
Thanks
I think you can read the Y Scales Positions, sort through them to find where they start and where they end and then set the property "Plot Area Size" and "Plot Area Position" to reduce/move it so that it doesn't overlap with the scales, I haven't tried though.
Good luck.
-
The support requirement is not for resolving an issue within 2 days, rather we want to provide customers and users with an expectation for how long they will wait for a response after submitting a support inquiry...
Well... If you go on the OpenG forum and check the timestamp difference between post asking for support and replies you may find out that in most cases answers come faster than 2 days and you also probably can find a few post that waited a bit longer than that. But what's the big deal?
Anyway, for a company that has a product on LVTN and applies for the gold level, how do you make sure they *always* provide support within 2 days?
Are you going to test them each week?
The OpenG community has been providing great support for a long time now. Amongst companies that have products on LVTN, who's going to provide the same level of support (in terms of response time AND quality) over the same period of time?


Problems uploading files
in Site Feedback & Support
Posted
Same for me, can't upload PNG file in a post or in a PM.
Using Firefox 4.