Leaderboard


Popular Content
Showing content with the highest reputation on 07/21/2020 in all areas
-
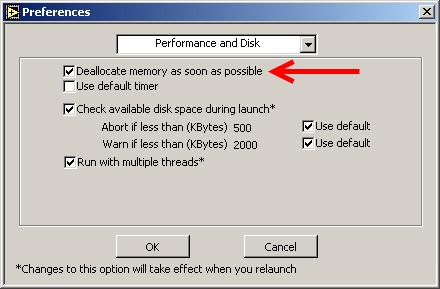
Well, they're obviously not enough to have an absolute control over SH, including memory pools management as per SH API. Unfortunately I don't see any other functions or private nodes exposed, except maybe FreeSmartHeapPool function of mgcore, but that one crashes LV for some reason. I'm afraid, my find about mgcore's switching is almost useless, because compiled app (i.e. EXE) uses lvrt.dll, which already has mgcore stuff integrated into it, so no way to disable SH in lvrt, as it would require its recompile from the sources. And I never saw any different versions of LVRT except a classic one and a Full Featured one. Honestly, I don't know, why LabVIEW is shipped with 4 variants of mgcore, even if it's using only one of them. Yeah, it doesn't help much, because it's like you have inserted RD block in the end of every VI. In LabVIEW before 7.x there was "Deallocate memory as soon as possible" checkbox in the settings. This setting was stored in INI as anxiousMemoryDeallocation token. In 7.x they removed the checkbox and likely renamed anxiousMemoryDeallocation token to overanxiousMemoryDeallocation. LabVIEW still tries to read overanxiousMemoryDeallocation on the start, thus it could be used if needed. Not much sense for that though. By the way, this wiki page should be updated as well.
 2 points
 -
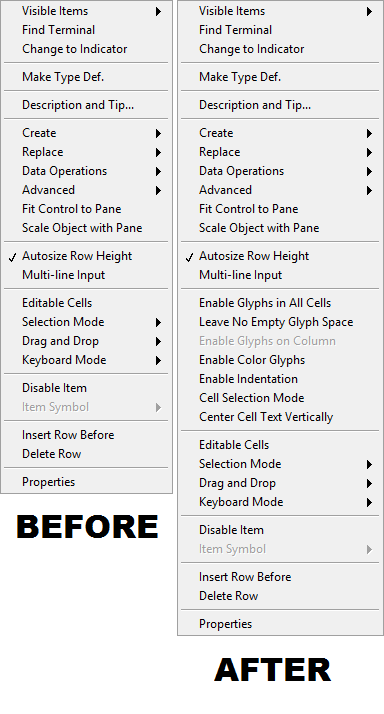
First off, let me say that this is yet another post concerning functionality that has not officially been released by NI, so the standard disclaimer about not using it in anything you care about applies here. Basically, if you add the line SuperSecretListboxStuff=True to LabVIEW.ini, it adds some additional options to the context menu for the list box control. Here's a comparison: Just thought I'd share this, since I googled the INI key and didn't find anything, so I figured nobody's found it yet.
1 point
-
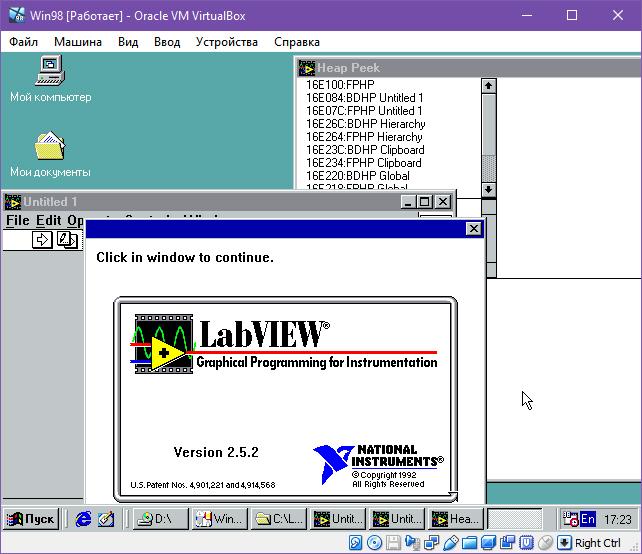
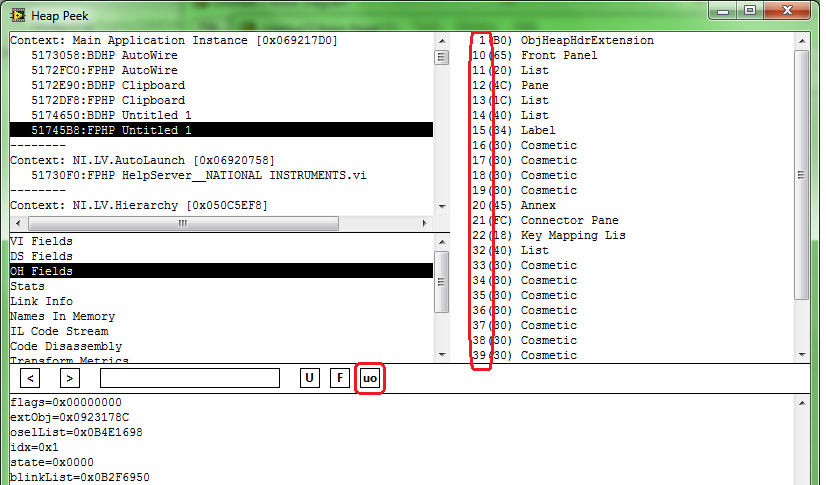
Chris' post here mentioned an NI internal debugging tool called Heap Peek that I hadn't known about. So of course after reading the wiki I immediately enabled it and started poking around. I can't find any other useful information online about it. Is there any other tribal knowledge on this tool or are there other things you have used Heap Peek for? I also discovered Ned (Ctrl-Shift d, Ctrl-Shift n) and a combo to show buffer allocation (d, q.) One key combo (d, ,) causes some BDs to be grayed out. I don't know what purpose it serves though. Any other known gems?
1 point
-
@dadreamer, nice find! Apparently these private properties should do exactly what you want: control SH behavior, but they allow to only control the size of large blocks (which shouldn't be the root of this problem) and don't seem to make any difference in my test anyway. Library replacement, on the other hand, eliminates this problem completely, even for blocks <256 bytes. Edit: Selective Deallocation is also available as an INI key along with a key "overanxiousMemoryDeallocation" (which doesn't help either).1 point
-
You can edit that wiki if you have more info. or write your comments in "Discussion" page if you're unsure about editing it directly. I created a whole category of articles there: https://labviewwiki.org/wiki/Category:LabVIEW_internals1 point
-
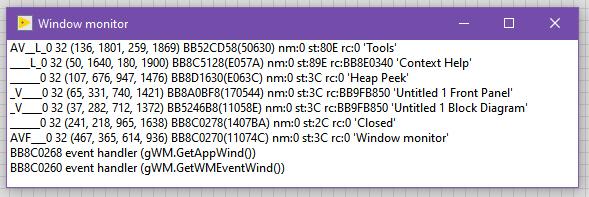
Hi! Great article, indeed. I'd like to add some little notes, that I've known of. - I saw Heap Peek in LabVIEW 2.5 already. I could propose, that it was always in LabVIEW, in any version maybe, but I can't check it right now, because I don't have LabVIEW 1.0 or 2.0 distros. - There exists another way to get Heap Peek window visible. You could use some utility to deal with applications windows, like WinSpy++ or Window Detective or any similar tool. Heap Peek is hidden window by default, but it may be displayed easily. - Those hex numbers in the upper right section of Heap Peek are the objects' addresses in LabVIEW memory, so they could be used to explore (or even modify) a single object's properties or any related data in your favourite debugger (of course, if you know, what you're looking for). - I believe, DCO stands for Data Controller Object and there's DDO also, that should be Data Display Object. I didn't study DDOs much (it's either a control or an indicator), but a DCO controls how and which data is passed through a single terminal (on BD) or control/indicator (on FP). You may find any SubVI's/node's terminal w/ Heap Peek and in its properties you should find an address of DCO assigned to it. The same is doable with controls and indicators on Front Panel. On BD DCOs are called Parameters or EFN Parameters (for CLFNs) or somehow else. On FP they're called FrontPanelDataControllers. It's easy to find them using "F" button of Heap Peek. Going to the original topic, there's "Window monitor" debugging tool also, which could be viewed with CTRL+SHIFT+D+W. It's able to display LV windows handles (HWNDs), positions, names and some other info's. Oddly nobody ever mentioned it on the forums, maybe because its use cases are very limited. It's not so convenient to use also, because its interface is very ascetic. WinSpy++ or the analogs do the similar work a way better.
1 point
-
Thousends of releases? I kind of doubt it. Leaving away LabVIEW prior to the multiplatform version (2.2.x and earlier which only were Macintosh) there have been 2.5, 3.0, 3.1, 4.0, 5.0, 5.1, 6.0, 7.0, 7.1, 8.0, 8.2, 8.5, 8.6, 2009, 2010, 2011, 20012, 2013, 2014, 2015, 2016, 2017, 2018, 2019 releases so far. Of each of them there was usually 1 and rarely two maintenance releases, and of each maintenance release between 1 to 8 bug fix releases. This does probably only amount to about 100 releases in total and maybe another 50 for beta releases of these versions (a beta has usually 2 to 4 intermediate releases although that tends to be no more than 2 in the last 10 years or so). I'm not aware of any LabVIEW release that had the debug symbols exposed. PDPs were used even in Microsoft Visual C 6.0, the first version that was probably used by NI to create a released LabVIEW version (NI only switched to use Microsoft C for the standard 32-bit builds for Windows NT, the Windows 3.1 versions of LabVIEW were created using Watcom C 10.x which was the only compiler able to create full 32-bit executables that could run on 16-bit Windows 3.1 through the built-in DOS extender runtime). Microsoft makes this anyhow pretty hard to happen by accident as such DLL/EXE files would normally link to the debug version of the Microsoft C Runtime library and you can't install that legally on a computer without installing the entire Microsoft C Compiler contained in the Visual Studio software. There is definitely no downloadable installer for the debug version of the C runtime engine. The only early leak I'm aware of was that the original LabVIEW 2.5 prerelease contained a huge extcode.h file in the cintools directory that showed much more than the officially documented LabVIEW manager functions. About half of it was still pretty much unusable as you needed other functions that were not exposed in there to make use of some of the features, and a lot of those functions were removed from the exported functions around LabVIEW 4.0 and 5.0 as they were considered obsolete or undesirable to pollute the exported symbols list, but it did contain a few interesting functions that are still exported from the LabVIEW kernel but not declared in the current extcode.h file. They fixed that extcode.h bug before the official release of LabVIEW 3.0, which was the first non-beta version of LabVIEW running on other computers than Macintosh. (2.5 was basically a beta release called prerelease version to have something to show for NI Week 1992 that runs on Windows 3.1, and there was a 2.5.1 and I believe 2.5.2 bug fix release of it in 1993). Also lvrt.dll is a development that only got introduced around LabVIEW 6.0. As this was released in 2000 it most likely used at least Microsoft Visual Studio C++ 6.0; Before that the application builder was concatenating the generated runtime LLB to a stub executable that contained the entire LabVIEW runtime engine. That was a pretty neat feature as it created a single file executable, but as LabVIEW was extended and more and more functionality implemented in external files and DLLs that get linked dynamically, this was pretty much unmaintainable in the long run and the entire runtime engine was externalized.1 point
-
Click the uo button (I think it means "UID ordered") to sort the objects by UID. The UID is the first number in the rows (see attachment) That should help you find it. I don't know why it's not not showing up in order in the memory-ordered list.
1 point