Leaderboard


Popular Content
Showing content with the highest reputation on 07/20/2020 in all areas
-
The Application class has a couple of private methods which can do this (called Global Data.Set and Get) which operate on a name and a variant value (I believe this goes back at least to 2009). I think this should persist across QD calls. Note that you should pick a name which will be different from other things which might exist in the system.3 points
-
Thanks, Rob! Very well done research with a lot of technical details, as we all here like. 🙂 After reading and re-reading your post and SH related documents and playing with the samples I still have one question. Can we control SH behaviour in any ways or is it up to LabVIEW Memory Manager completely? Say, could I make SH to empty its pools and free all the data cached, thus reclaiming the space occupied? Or it never gives it back to me entirely? Could I disable SH utilization somehow or is it hardcoded to be always on? I found few private properties to control Memory Manager settings, e.g. Application.Selective Deallocation, Application.Selective Deallocation.EnableForAllVIs, Application.Selective Deallocation.LargeBufferThreshold and Application.NeverShrinkBuffers, but playing around these doesn't help much. I would say, it even worsens the situation in some cases. Currently I see no way to return the occupied memory, thereby LabVIEW can (and will) eat as much memory as it needs for its purposes. So, we have to live with it, don't we?.. upd: I think I found something. In [LabVIEW]\resource folder there are four variants of Memory Manager library: mgcore_20_0.dll - no SH, no AT (Allocation Tracker) mgcore_AT_20_0.dll - with AT mgcore_AT_SH_20_0.dll - with both SH and AT mgcore_SH_20_0.dll - with SH LabVIEW uses SH version by default. If we switch to "no SH, no AT" version by backupping mgcore_SH_20_0.dll and renaming mgcore_20_0.dll to mgcore_SH_20_0.dll, then the memory consumption is somewhat reduced and we get more memory back after RD was called. On default mgcore_SH_20_0.dll I'm getting these values: LabVIEW is opened and the example is running - 199 056 KB; After the string array was once created (RD is on) - 779 256 KB (the peak value is at ~800 000 KB); After the VI is stopped and closed - 491 096 KB. On mgcore_20_0.dll I'm getting these values: LabVIEW is opened and the example is running - 181 980 KB; After the string array was once created (RD is on) - 329 764 KB (the peak value is at ~600 000 KB); After the VI is stopped and closed - 380 200 KB. Of course, it all needs more extensive testing. I see however, that "no SH, no AT" version uses less memory for the operations and so it could be prefferable, when the system is fairly RAM limited.2 points
-
Yup, Quick Drop itself (along with several other G-based LabVIEW features) uses Global Data Get/Set. Standard disclaimers apply (private methods are not documented or supported by NI), but these should get you what you need. I agree with Yair that you need to make sure to namespace your data appropriately so it doesn't potentially collide with other Global Data.1 point
-
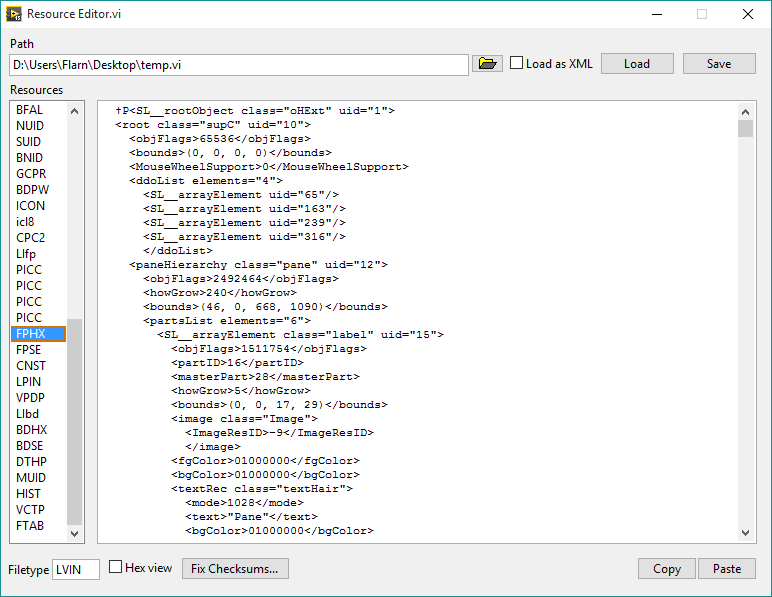
One thing I've always wanted (and have asked about here before) was a way to edit the data inside VI files at a low level. Well I finally figured that out. I have here a tool that will let you open a VI, look at the individual blocks of data stored within, and make changes. Plus, with the power of private methods and internal settings, it can also convert VI's to a format where the front panel and block diagram are XML-based, so you can easily edit the raw representations of objects. Here you go. Run "Resource Editor.vi", select a VI (make sure you make a backup first if you care about it), and click Load to load its resources. Click "Load as XML" if you want to edit the front panel and diagram as XML. If you've edited the block diagram at all, make sure to click Fix VI Checksums. Then just click Save once you've made the changes you want. EDIT: Second version is posted; this one should work in LabVIEW 2014, and fixes some bugs. I also added copy/paste buttons for the front panel and block diagram resources, since LabVIEW's built-in copy/paste function didn't seem to work for some reason. Note that if you edit the front panel or block diagram in the VI without using copy/paste (and the size is different), you need to update the size (first 4 bytes) as well. You can do this by clicking Copy and then Paste. Now this may not be too useful for you, considering it's not something you should use in production code or anything you don't want to break. (I say that a lot in my posts, don't I?) But if you're curious about how VI's work internally, it's perfect. This requires OpenG. Also, special thanks goes out to Thomas Zeugner for making VI Explorer. You know, that tool for cracking VI passwords. Turns out he figured out how the VI checksum (in the BDPW block) is calculated, which helped me greatly. Oh, one more thing, I do plan on improving it. I was just excited to share what I had. So keep in mind there may be bugs. Latest version: The latest version is posted on the tool's home page, here: http://flarn2006.dyndns.org/llvim/ Older versions: Low-Level VI Manipulation rev2.zip Low-Level VI Manipulation.zip
 1 point
 -
I usually don't recommend using the first token unless you are trying to capture a specific crash. Full crash dumps can be very large and not only will crashes generate full dumps but all DWarns will create full memory dumps so the LVInternalReports folder will get pretty enormous in most cases. I'm not 100% certain but doesn't the DWarnDialog token just show a modal dialog window on any DWarn? I remember doing something like that at one point and just found it very annoying personally.1 point
-
To ensure NIER collects the most useful information, you need to set a few INI keys on the process that is executing the LabVIEW code (Development System: LabVIEW.ini in the LabVIEW directory; Run-Time Engine: in a [LVRT] section within the .ini file next to the executable). INI keys: NIERDumpType=full LVdebugKeys=True DWarnDialog=True DPrintfLogging=True promoteDWarnInternals=True Of these keys, you should always set the NIERDumpType=full key when debugging an issue, because this key will cause a larger crash dump with more debugging information to be created. The other INI keys can be used to gather more information, but they have the caveat that they will slow execution of the code down, which can be a problem for certain types of issues. It is also important to note that when NIER creates a full crash dump, it should not be submitted to NI through the NIER crash dialog. The NI system is not prepared to handle crash dumps as large as those generated by NIER with the INI key enabled. (I got this information from an NI support person long time ago, I'm not really sure if all of this still applies. But perhaps it helps?)1 point
-
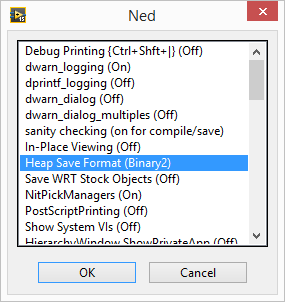
Warning: This shouldn't come as a surprise given the title of the thread (as well as who's posting it) but this is NOT officially supported by NI. Don't use this for anything you don't want to break! I ran a VI that recursively opened every VI in the LabVIEW installation directory and scanned it for Call Library nodes, then saved anything it found to a spreadsheet. And guess what it found in the palette API? Functions that open and save "resource" files, which happen to be the way VI files are internally stored, as well as some other LabVIEW files. It lets you manipulate the internal resources as an array of clusters. Now in case you didn't already know, the front panel and block diagram are stored as binary resources (known as "heaps") in this file, and these functions can't parse that format. So it's not too useful, right? Wrong. Does this dialog look familiar to anyone? That's the hidden internal settings dialog, known for some reason as Ned. To access it, add LVdebugKeys=True to your LabVIEW.ini file and restart LabVIEW if it's already running. Now hold Control+Shift and press D, N. You have to press the keys relatively quickly for it to work. (You can press D, H instead to open Heap Peek, which lets you view the internal representation of objects, as well as their exact location in memory--think about how the latter might be useful!) Now do you see that option I have selected? "Heap Save Format (Binary2)". Click that a few times, and you'll see one of the options is XML. Yep, it turns out LabVIEW has a hidden XML-based VI format. It even opens just fine with the heap save format set to the default. Keep in mind only the heaps are saved in this format; the rest of the file is still binary. But that format can be parsed by those library functions I found. Unfortunately, it seems the block diagram has some sort of checksum and the VI won't load if that's wrong. I know this because after making a simple change to the XML (changing the block diagram's background color) it didn't load, and there was a a 16-byte section in the file that was changed with seemingly-random data. I suspect that this is MD5, considering that seems to be the standard LabVIEW uses, but I tried calculating the MD5 hash of certain parts of the file and it didn't seem to match. Here's two VI's that you can use to turn resource files (like VI files) into resource cluster arrays, and vice versa. Load Resource File.vi Save Resource File.vi And here's a VI that will automatically set the heap save format to XML (using the private method "Application.Call Internal Command"), save a VI (from a refnum), and then put the heap save format back to what it was before. So it basically just saves a VI in the XML format. Save VI with XML Heaps.vi
1 point