rpursley
-
Posts
48 -
Joined
-
Last visited
Content Type
Profiles
Forums
Downloads
Gallery
Everything posted by rpursley
-
Is Possible to Play the mp3 via LabVIEW using ActiveX?
rpursley replied to a topic in Application Design & Architecture
Try this. ActiveX WMP.vi -
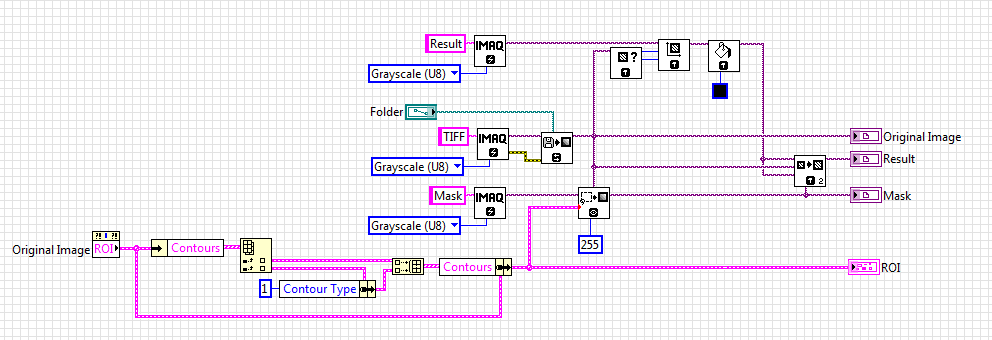
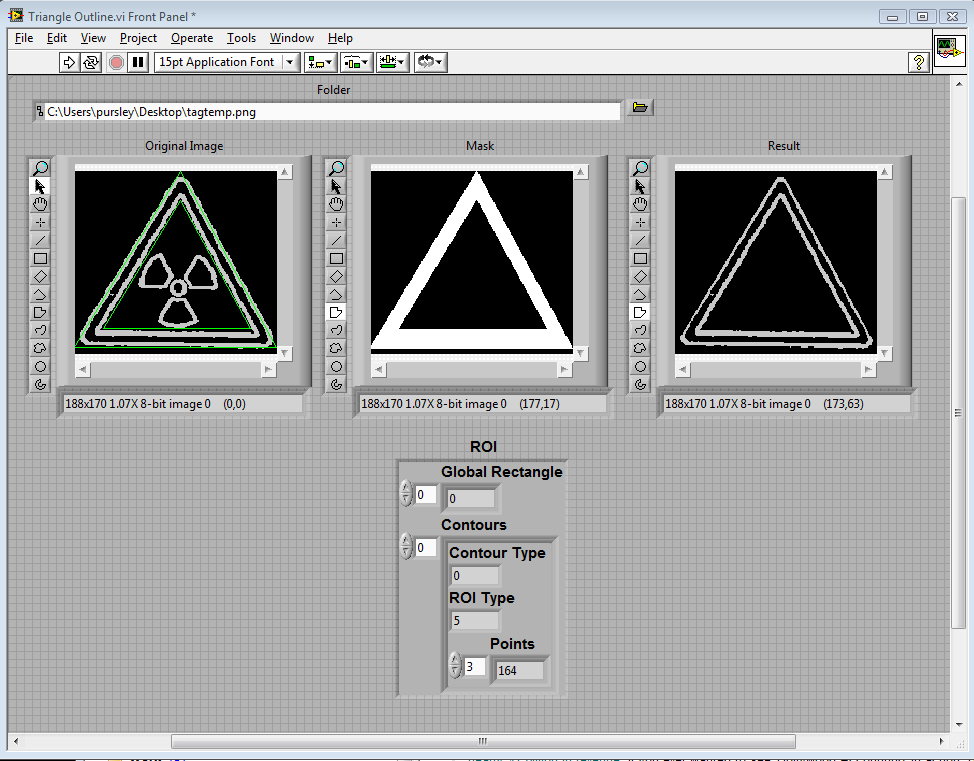
You can create and ROI like you want. Draw two triangles using Polygon, one inside the other (holding down the Ctrl key allows you to add another ROI to the image control). Read the ROI property to get the data for the ROI. There should be two contours listed in the order they were drawn. If the inner triangle was drawn second, then read out that contour and set the Contour Type (Contour ID) to 1 (Internal) and the write it back. There is a bug present in LabVIEW that doesn't keep the Contour Type (Contour ID) value when you read it from the ROI property, but it does write it properly. Triangle Outline.vi

-
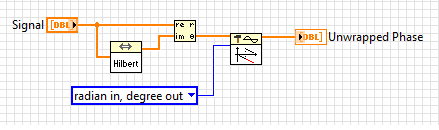
Take a look at using the Hilbert Transform to turn each of your signals into an analytic signal (original signal is real part, Hilbert transform signal is the imaginary part). Then you can get the phase of the complex number.
-
Here it is. Sorry it took so long to respond. Thermal Imaging Color Table.vi
-
Attached is a vi (LV 2009) that contains a Intensity Graph and the code needed to generate a close approximation to the desired color scheme. Just feed your data into the Intensity Graph and it hopefully will look like you want it. Colors components in the plot are ordered RGB. Thermal Imaging Color Table.vi
-
I've installed LabVIEW 2009 32-bit and 64-bit on both Vista 64-bit and Win 7 64-bit and have had no problems. My 32-bit version has FPGA, RT, Mathscript, and Vision installed as well. The 64-bit has Vision installed.
-
Take a look at Lantronix. Haven't used them in years but they worked great when I needed it. Lantronix
-
Take a look at using a Hilbert Transform on your pulses. Create an analytic signal (original signal + j (Hilbert transform of original signal)) and the magnitude of this signal will be the envelope.
-
What is the bit resolution of the acquired data? Do you have enough resolution to resolve two signals 3 orders of magnitude different (at least 16 bit data is needed)? If so, can you post some of the data?
-
Name: Hover Button Xcontrol Submitter: rpursley Submitted: 02 Jul 2009 Category: X-Controls LabVIEW Version: 8.2 Version: 1.1.0 License Type: Creative Commons Attribution 3.0 Make this available on the VI Package Network?: Undecided Copyright © 2007, Randall Pursley All rights reserved. Author: Randall Pursley --see readme file for contact information Description: The is an Xcontrol that gives a Boolean button, Hover button functionality. As the mouse 'hovers' over the button, the appearance of the button changes to indicate that is the case. The change in appearance can be user defined initially and programmatically. Dependancies: Labview 8.2.x or higher hopefully any OS (tested with XP) Change Log: 1.0.0: Initial release of the code. 1.1.0: Added ability to change Font properties of boolean text Click here to download this file
-
1,481 downloads
Copyright © 2007, Randall Pursley All rights reserved. Author: Randall Pursley --see readme file for contact information Description: The is an Xcontrol that gives a Boolean button, Hover button functionality. As the mouse 'hovers' over the button, the appearance of the button changes to indicate that is the case. The change in appearance can be user defined initially and programmatically. Dependancies: Labview 8.2.x or higher hopefully any OS (tested with XP) Change Log: 1.0.0: Initial release of the code. 1.1.0: Added ability to change Font properties of boolean text -
I had some delay problems when there were a couple toolkits on a machine with an expired license for that toolkit (primarily VI Analyzer). Once I uninstalled them, the problem disappeared. QUOTE (Jim Kring @ Mar 16 2009, 12:58 PM)
-
It appears that the output of the USB snap function is always a RGB U32 image, regardless of what the input image is. That is why you are getting the error. The IMAQ Count Objects 2 vi will not accept and RGB image. After the USB Snap, add an IMAQ Cast Image vi to convert it back to a U8 image and then pass it to the IMAQ Count Objects 2 vi. QUOTE (X_DOT @ Mar 16 2009, 10:52 AM)
-
Image Stitching with Labview
rpursley replied to professor_rumsdiegeige's topic in Machine Vision and Imaging
I've only successfully done it by integrating calls to Photoshop from LabVIEW. I do not know of any LabVIEW toolkits for this. QUOTE (professor_rumsdiegeige @ Feb 26 2009, 04:36 AM) -
First thing I would do is add some external circuitry to turn the RF pulses into a pulse. The easiest way to do this is use a diode to rectify the signal and then filter it to remove the higher frequency stuff. You would only need a simple AM demodulation circuit. A resistor around 1 kohm and a capacitor of 1 uF should be enough. If this doesn't give you the kind of response you need, then a more complicated approach might work. 1. Maybe amplify the signal 2. Use a comparator to turn it into a digital signal 3. Use a one-shot in retriggerable mode to get the envelope of the signal Hope this helps some. QUOTE (Danyc @ Feb 7 2009, 12:11 PM)
-
Is there a way to Capture Array Element Event?
rpursley replied to Minh Pham's topic in User Interface
QUOTE (vugie @ Dec 22 2008, 04:48 AM) You can use something like this to get the index. It can be contained in a single sub-vi. -
Spectral analysis of an acquired signal
rpursley replied to fuzzycontrolfreak's topic in Application Design & Architecture
You are definitely losing your sampling rate/dt information. Attached is a picture of your block diagram with a couple changes that should fix it. -
My installation went fine. It did take all day. I have opened and run 4 or 5 different projects and have not had any problems as of yet.
-
How about this. 1. Find Xmin, Ymin, Xmax, Ymax for each smaller circles (Xmin = Xcenter-radius, Ymin=Ycenter-radius, Xmax=Xcenter+radius, Ymax=Ycenter+radius). 2. Use the smallest min values and the largest max values of all of the smaller circles to define a rectangle. 3. Find the center of this rectangle (Ax, Ay). This should be the center of the circle that would encompass all of your circles. 4. Measure the distance from this center (Ax, Ay) to the farthest edge of each circle relative to this point (magnitude of distance from center to center plus radius of each smaller circle. 5. The largest of these measures should be the radius of your encompassing circle.
-
The Time node returns the same value as the Tick Count (ms) function. It is the current value of the millisecond timer. This is a free running timer that has a max value of (2^32)-1 and then resets. QUOTE(Val Brown @ Feb 20 2008, 02:28 PM)
-
Try the attached example. It uses the event structure to trigger the reads and also allows instant stopping of loop. QUOTE(patufet_99 @ Feb 15 2008, 08:32 AM)
-
It would have been nice if they added a little delay (half second or so) of no mouse motion before popping anything up the mouse is hovering over. Then it might be interesting to use.
-
QUOTE(BrokenArrow) I get 505 ms without zero timer I get 680 ms with zero timer
-
There are three things you can do to deal with this. 1. Add a filter before the peak detection to filter out the higher frequency peaks. Your data has a small bandwidth (~5-10 Hz). This will eliminate the narrow close together peaks. 2. Play with the width of the peak detector to optimize it for your data. 3. After peak detection, add some code to throw out peaks that are too close to other peaks. You know that heart rate falls within a specific range (40-300 beats/min). Any peaks that produce a heart rate measurement outside of this range are peaks that can be thrown out. QUOTE(Stevio @ Dec 18 2007, 12:21 PM)
-
I believe x dot y = mag x * mag y * cos(alpha) In your case you only mention phi and theta so I assume they are unit vectors. x dot y = cos(ALPHA) = [cos(THETAx-THETAy)*sin(PHIx)*sin(PHIy)] + [cos(PHIx)*cos(PHIy)] I think my math is right.