Ano Ano
-
Posts
132 -
Joined
-
Last visited
Content Type
Profiles
Forums
Downloads
Gallery
Everything posted by Ano Ano
-
Dear ensegre, I just send you a PM
-
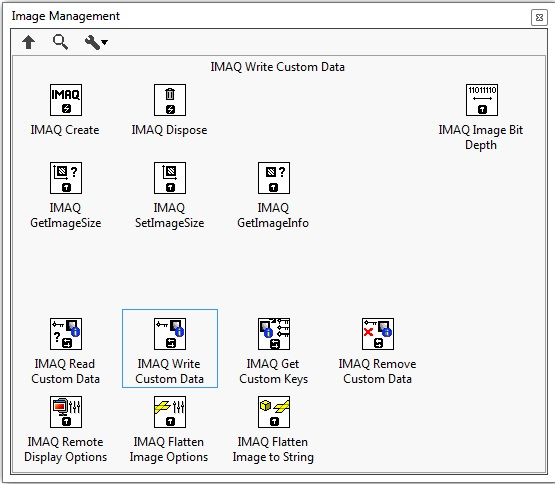
Dear ensegre, As you can see from the attached picture, some vi's are missing from the "Image Management" menu and the External Library Support menu is missing. Any idea what I forgot to install? Maybe its an incompatibility between LV17 & Vision 2016.

-
Thank you very much for your prompt answer. I would prefer if I could find just those 2 vi's rather than re installing the suite -It takes ages! These two vi's are the only ones missing to get the thermocamera's vi's working. I no longer need NI Vision's full capabilities so there is no other need to roll back to LV15. If you have these vi's please upload them. Thank you in advance
-
Dear kanchi101, I did not find a solution via Modbus. I ended setting motion tasks via the Kollmorgen workbench software and controlled these via sending a set of boolean logic signals. These signals can be registered on the Digital I/O section of the Kollmorgen Workbench software. I also read the position of the motor via the analogue out of the drive. If you need more info let me know
-
Hello, I recently upgraded from LV2015 to LV2017 and although I have the Vision 2016, the new installation somehow deleted(?) two useful vi's. Can anyone please upload the: IMAQ Cast Image IMAQ imagebordersize Anyone knows why this happened? Thank you in advance
-
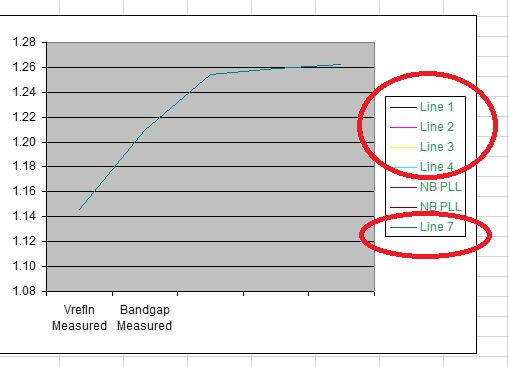
Hello, I am trying to familiarize myself with ActiveX & excel and I am using a vi (attached) that I found online. and when I run it excel opens up and in the graph the plot legend has 7 plots listed instead of 1. How can I change this to go according to the number of plots I actually have? Thank you in advance Add Graph and Format Legend.vi
-
Hello, I am trying to use the Report Generation Toolkit to input nth XY plots in excel. I can input the data in excel but when I try to use the LV function to plot them, at best excel uses the first column as an X-Axis and the rest columns as nth-Y-Axis. Does anyone know how to plot multiple XY axis in excel? Thank you in advance
-
Hello, I have a NI USB-6001 and I am trying to run the attached simple vi and I get an error 200279. It supposed to just acquire an analogue & a digital signal. Can someone help please? Thank you in advance AI & DI 1.vi
-
Thank you!!!!!
-
Hello, In the the attached vi there is the followiing operation: When the boolean (Acquire) turns on, an array starts to fill with data, when that boolean turns off the user can decide to "keep" that 1D data by pressing a boolean button (Keep) and thus incerting that 1D array into a 2D array. When the user repeats the process the 2D array should populate accordingly; one row of 1D data each time the keep is pressed. As you can see from the attached vi, when the user presses the keep button, the 2D array continuously fills with the acquired array. I "prevented" this by adding a 1sec timer but its a bit unstable. Is there another way of doing this? Thank you in advance 2D array filling.vi
-
Thank you both for the prompt answers. The application is for testing a strain sensor against an increasing load. The aim is to start the vi and then press a start boolean button to start acquiring data until another boolean stops the acquisition. The acquired multichannel data need to be plotted against time, starting at 0sec and ending ie 10sec later. When the user presses the start button then the graph starts at 0sec and plots the new data. Thus my weird X-axis if for counting the time passed in sec while the boolean is true and all this on-off is what is causing the buffer issues. Any ideas?
-
Hello, This is probably a silly question but my mind is stuck! Attached there is a simple voltage acquisition vi. The aim is to have a case structure in a while loop and acquire-plot data from a sensor when the case structure is true. The displayed data needs to be plotted against time in seconds starting from 0 and ending in Xsec. Each time the case structure is true, the x-y graph needs to display the new data with the time starting at 0. The vi does not do that, instead the old data remains on the graph and on top of that the vi gives an Error -200279 after a while. What am I doing wrong? Voltage - Continuous Input.vi
-
Hello, I have a graph with data as follows: X Y 0 1 1 4 2 15 3 33 4 48 5 64 . . . . 100 200 and I want to "stretch" the Y-axis data like: X Y 0 1 1 y2 2 y3 3 y4 4 y5 5 y6 . . . . 100 500 ie I want the same y-axis starting point, a new end point and the same number of x-axis points. I dont mind more y-axis points, just to preserve the shape of the curve. Any ideas?
-
Hello, I have an acquired string (not array) that has a repeatable pattern: 2014062414:17:50.401B 0E 0E 2014062414:17:54.603 0E 0E 2014062414:17:55.648D 0E 0E 2014062414:17:55.862A 0E 0E 2014062414:57:10.786 0U 0U 2014062414:57:11.841 0U 0U 2014062414:57:18.112 34 11111 2014062414:57:19.157 34 11111 .... This is an array made up from a time-stamp and certain values (settings). The aim is to convert it to a 2D array and each row will be a 4 element 1D array in the following format: 2014062414:17:50.401|B|0E|0E| where "|" is placed to denote a different cell. The problem is that that the array has 1,000,000 time-stamps & set of settings ie a few million characters, hence using loops to manipulate it make my pc run out of memory! In addition the second setting "B" in "2014062414:17:50.401B 0E 0E", sometimes it appears, sometimes its another word character (ie A) or sometimes its a "space" character, always attached to the time-stamp. I am looking for a way to create a space between the time-stamp & the character if present in order to, further down the line, create a column with the word characters. Any suggestions? Thank you in advance
-

Detect straight lines & their angle on a waveform
Ano Ano replied to Ano Ano's topic in LabVIEW General
Hello, I reached to a good point in detecting when its a straight line (T) and curve (F) in an array. But my mind is blocked on how to extract Nth arrays of straight lines! Please check the attached code and tell me what I am doing wrong Differentiator and Smoother.2.vi Savitsky-Golay Differentiator Core.vi Second derivative 5.vi -
Detect straight lines & their angle on a waveform
Ano Ano replied to Ano Ano's topic in LabVIEW General
Thank you for your prompt reply! I created a curve (see attached file) that is made from a straight inclined line (0-190) a curve (190-812), another inclined straight line 813-987) and a third inclined straight line (988-1000). I made an effort and managed to locate when the slope changes but how can I tell which is the curved and which is the straight part of the plot? The second derivative does not show something useful. Thank you in advance Second derivative 2.vi Differentiator and Smoother.2.vi Savitsky-Golay Differentiator Core.vi -
Hello, I am interested in detecting the straight lines in an arbitrary graph and the line's angle. As in the attached photo, the waveform has many "straight sections". Detecting a straight section while it is at an angle is a bit tricky. Any ideas on how to do it?
-
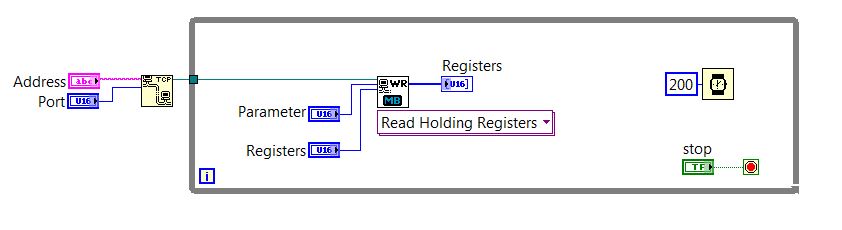
Hello, The only code that works to communicate with the drive is attached. I can read the "588" parameter and get the position of a Kollmorgen motor (AKM13C-AKCNGD00). I went through the parameter list and they have 1760 instructions but I have no idea which one can make it move (write). I keep getting errors. Any suggestions?
-
Thank you for your reply! Yes the Ethernet/Modbus seems to be a good solution. I dont support there a code snippet to share to test that I can connect properly? I never programmed Modbus so I could use all the help possible
-
Hello, I have to set up a system that uses the following Kollmorgen components: Servomotor AKM24D-ANBNR-00 Drive AKD-P00306-NBCC-E000 I am interested in creating with LabVIEW an application to control the motor by sending a speed profile. I read that NI has teamed up with Kollmorgen and created a series of hardware (such as the NI-9514 cDAQ) that are used in conjunction with cRIO hardware & the RT/FPGA software (http://www.ni.com/pdf/manuals/375516c.pdf). Unfortunately this is a very expensive option, and I thought that there must be a solution just using a PC and a cheap cDAQ or serial/modbus/ethernet communication method. Are there any suggestions on how to do this? Anyone with experience on the Kollmorgen hardware? Is it going to be difficult & time consuming? Thank you in advance
-
Hello, I have a 2D nth array, ie: 1 2 3 4 5 6 2 3 7 8 9 4 7 8 3 45 7 1 ... 2 5 1 8 1 5 I want to take the first three rows, add the elements together and create a new row that will replace the three rows and I want to do this every three rows and create a nth/3 2D array. Any ideas? Thank you in advance
-
Thank you all for the replies. The evaluation board comes with a software (*.exe & *.dll) written in .Net Framework v4.6 (I used a decompiler to find out!). The problem now is how to load it in LabVIEW. There is no .h file accompanying the .dll and if I import "connectivity>.NET> property/invoke then there is a huge list of commands but its not clear what to use to read & write. By the way the DS8500 is a HART modem.
-
I have a DS5800 evaluation kit from Maxim Integrated and it comes with a USB port to read/write data. It also comes along with Maxim's software to read/write string data. I thought of interfacing it with LabVIEW and read from it. I tried to use the generic USB vi's in the example finder just in case I can read something but as expected it cannot even see anything connected. Is there any way to get information from this or any USB port?
-
Thank you for the replies. This is the first time that I am doing freelancing job on my own. So there is no company overheads or a manager/salesman to make discounts! So the bottom line is, after adding hardware costs, incurred expences & labor, what is a reasonable & competitive percentage that I should add on top as profit?
-
Hello, Does anyone know of a reliable & affordable industrial PC with a decent spec to run a cDAQ chassis? I keep finding very expensive solutions online...