Leaderboard


Popular Content
Showing content with the highest reputation on 08/10/2016 in all areas
-
Please see the above link to download the videos The NIWeek 2016 Videos are uploaded to the ftp server. Please see this link for information on downloading the videos. https://lavag.org/topic/19154-ni-week-2015-videos/#comment-1154441 point
-
Sure thing, attached is a somewhat crude approach that isn't easily scaleable but I think it is pretty simple. You have 4 shift registers for the data to log, and 4 more for the data in the graph instead of chart which has the benefit of having it's own buffer, but you have less control over it, like when it gets updated. If you have more than 30 samples of data log it, this should be roughly once every 500ms. This can be increased or decreased as needed. After getting 30 new sample the data is appended to the end of the graph data, but if more than 1000 samples are in a graph, only the last 1000 are kept and shown. Also the graphs will only be updated at most every 250ms. Then after it stops executing the samples in the buffer that haven't been logged yet, are logged. This will be samples between 0 and 30 that haven't been logged because there wasn't more than 30 at a time yet. I also added a feedback node to measure the loop rate and put it on an indicator and chart. Removing this will likely cause better loop rates, but if I were you I'd be curious what rates you get, and maybe remove this code once you are sure it is working well enough. TDMS_Logging_Simple_4chan hooovahh edit.vi1 point
-
As far as the code goes I think it is pretty simple, and looks right. You have continuous sampling which is good, multiple finite reads is something I wouldn't recommend here. I might suggest a few improvements to have better performance, not that what you are doing is wrong. But I notice you are reading 28 samples at a time, and your DAQ session is setup to sample at 1612.9 Hz. This means your loop rate will be no less than 17ms per iteration. This seems relatively fast. Imagine if updating the graphs, and redrawing them, and logging the samples to disk takes 20ms what will happen? Well samples won't be lost, right away it will just lag behind, and the data you log will be more and more from the past, until your DAQ read buffer fills up and then you'll get an error and stop. Also even if you don't full the buffer and error out, clicking Stop will stop and the data in the buffer that you haven't read out yet won't be logged either. To help with this you can choose to not update the UI with every iteration, but instead just update it a couple of times a second which will probably be enough for most users. Also instead of logging each sample as they come in, you can build a buffer of samples, and then when you get so many, log them at once. The overhead of logging single point data to a TDMS can be larger than the payload of data to log. This may mean a few changes with shift registers to keep track of the data in your own buffer, and changing the charts to graphs. Of course a more simple solution if you can get away with it is to take more samples at a time, or making a seperate loop where you log, and update the UI.1 point
-
When I was beta testing the Embedded UI the behavior I saw was this (hopefully this isn't too off topic): When the Embedded UI was disabled in MAX the behavior of the system was consistent with typical RT targets (e.g. don't use event structures with front panel events) When the Embedded UI was enabled in MAX it worked (with some caveats) just like VIs running under windows When the embedded system is remotely controlled, e.g. you are deploying and interacting with the target from your development system event structures work properly When you disconnect from the target you can then interact with the VI directly from the cRIO via KB + Mouse, and VIs with event stuctures properly processed everything The application I was testing was the standard QMH with an event loop and a message handling loop. So, if the embedded UI is enabled, UI Events are supported!1 point
-
So I'm apparently terrible at handling the undo stack but I can detect when you right click a TES or a DDS. All you need to do is attempt to change the enabled case away from the current one. A TES can't have an arbitrary case enabled, it will always enable the first one with no broken wires. So with scripting you try to enable case 1 and if it doesn't get enabled then it is a TES if it does get enabled it is a DDS. I tried fixing the undo but I just couldn't figure it out. Currently right clicking on any structure will wipe away the undo stack. I tried doing a begin and fail but an undo begin has already started as part of the right click API so I'm not sure what to do in that case. Replace with TES.llb1 point
-
Since there doesn't seem to be a good way to get this structure from the palette I created a right-click plugin that will replace a Diagram Disable Structure with the new Type Enable Structure. If you right-click a DDS, you will now see the option to "Replace with Type Enable Structure" underneath the "Replace with Conditional Disable Structure". As a warning, LabVIEW doesn't seem to like what I did and will crash sometimes when undoing or when replacing a TES with a TES. If you can easily see what I did wrong please let me know. Also, if you can find a way to figure out when you have right-clicked a TES and not a DDS it would help solve the second problem. Replace with TES.llb1 point
-
Okay now that LabVIEW 2016 is out, and the Mac version of 2016 is also out, I went and downloaded these VIMs that were in the user.lib. I hope I'm not doing anything wrong in posting them here, because these are files that are just available in the evaluation install anyway. When asking around the unofficial name for this new structure that automatically enables which ever case has no broken wires is the "Type Enabled Structure". It looks and behaves very similar to the disable diagram structure but specific cases cannot be enabled by the developer, and the border is a bit thicker. As always with unofficial features, don't be surprised if it changes functionality, or support, or gets removed with new versions of LabVIEW. My presentation on XNodes, and VIMs is available here, under the 2016 Advanced User Track. 2016 User.lib Macros.zip1 point
-
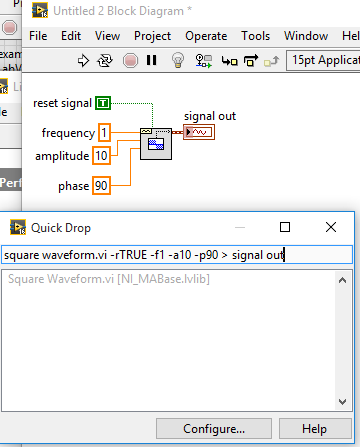
The "CLI or Die" posse are definitely in the driving seat at NI and perhaps that's why QD is so popular. If you add superduperCLIorDIEquickdrop=true to the LabVIEW ini file in 2016 you can do this Expect this in LabVIEW 2017, now
 1 point