GregFreeman
-
Posts
323 -
Joined
-
Last visited
-
Days Won
6
Content Type
Profiles
Forums
Downloads
Gallery
Everything posted by GregFreeman
-
SmithD's response seems to be the general consensus I think. Mark, this is a good quote I'm stealing "if more than one class uses a typedef than is belongs to neither " Interesting about the translation classes. Translating the types was actually something I considered, but then I ruled it out because I thought I'd end up with too many types that were essentially duplicates of each other. I'll take a look at his presentation if I can dig it up. I started thinking about other languages such as C# and how they would handle this. I realized most methods would return classes or interfaces, not structures. And I started thinking about why that would be decoupled, and it's because the classes being returned are not owned by any other class. So this gave me my answer. Make sure the typedef isn't owned by any other class, and it effectively just becomes a POCO.
-
I currently have a project that I am refactoring. There is a lot of coupling that is not sitting well with me due to typedefs belonging to a class, then getting bundled into another class which is then fired off as event data. Effectively, I have class A with a public typedef, then class B contains ClassA.typedef and then class B gets fired off in an event to class C to be handled. Class C now has a dependency on class A which is causing a lot of coupling I don't want. For my real world example I query a bunch of data from our MES, which results in a bunch of typedef controls on the connector panes of those VIs. Those typedefs belong to the MES class. I then want to bundle all that data into a TestConfig class and send that via an event to our Tester class. But, now our tester has a dependency on the MES. I see a few ways to handle this. First is move the typedefs currently in the MES class, to the TestConfig class. The MES VIs will now have the typedefs from the TestConfig class on their connector panes, but at least the dependency is the correct "direction." Or, I can move the typedefs out of classes all together, but then I am not sure the best way to organize them. Looking for how others have handled these sorts of dependencies.
-
For completeness, this is the c# code where I'm now seeing matching (slow) timing numbers. namespace TestAdodbOpenTime { class Program { static void Main(string[] args) { Stopwatch sw = new Stopwatch(); for (int i = 0; i < 30; i++) { ADODB.Connection cn = new ADODB.Connection(); int count = Environment.TickCount; cn.Open("Provider=OraOLEDB.Oracle;Data Source=DATASOURCE;Extended Properties=PLSQLRSet=1;Pooling=true;", "UID", "PWD", -1); sw.Stop(); cn.Close(); Marshal.ReleaseComObject(cn); int elapsedTime = Environment.TickCount - count; Debug.WriteLine("RunTime " + elapsedTime); } } } } Output: RunTime 218 RunTime 62 RunTime 47 RunTime 31 RunTime 63 ...
-
EDIT: You might be spot on smithd. I added Marshal.ReleaseComObject(cn) in my for loop and the times match almost perfectly to the LabVIEW ActiveX implementation. Just confused if that is being called under the hood of the open somehow, how the close connection would work. That reference would then be dead. That's one thing that makes me thing this may be a Red Herring. That's definitely a good thought that didn't cross my mind. I changed the LabVIEW code to leave the connections open but still no luck.

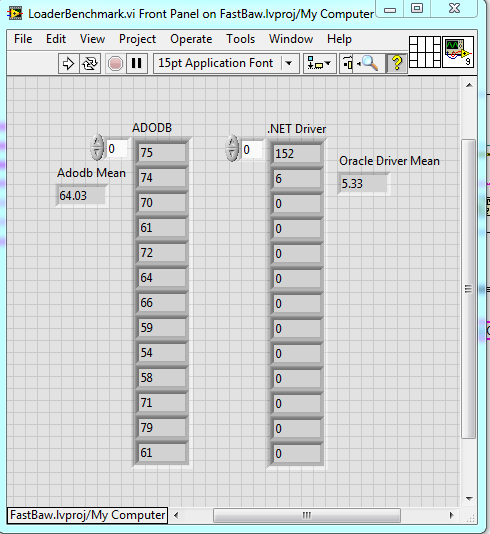
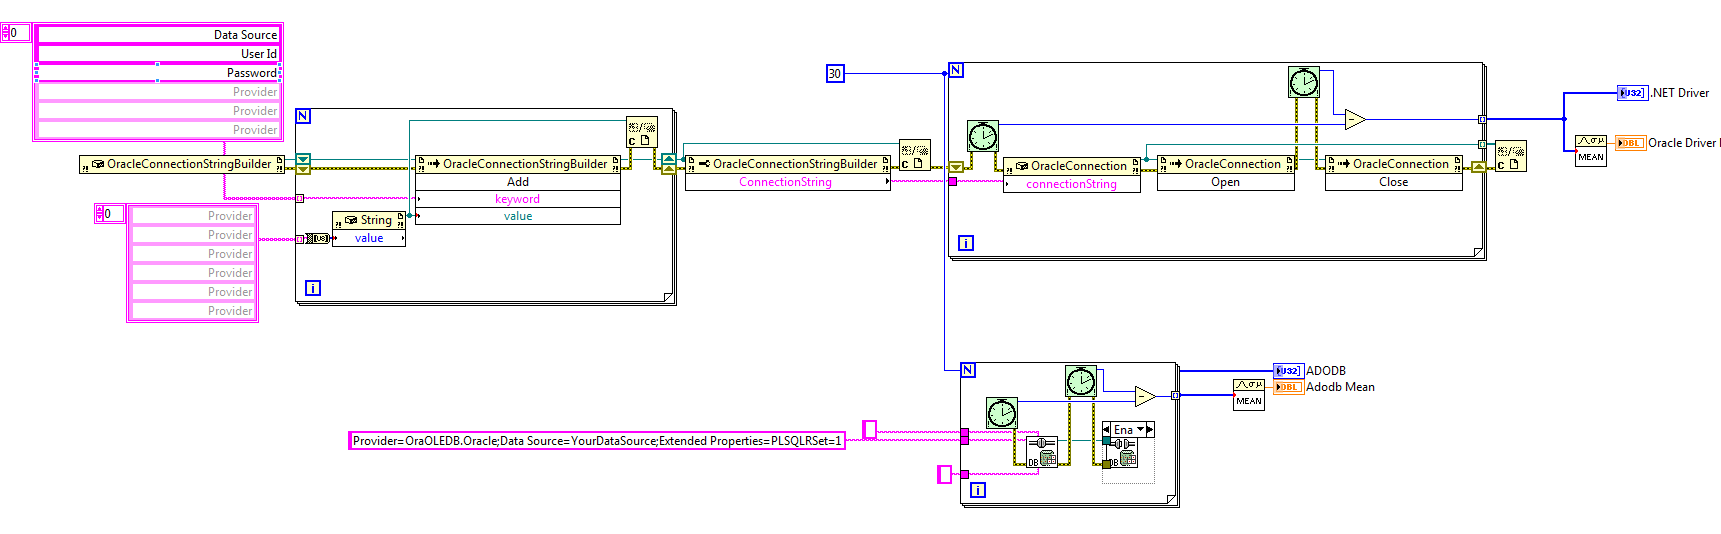
-
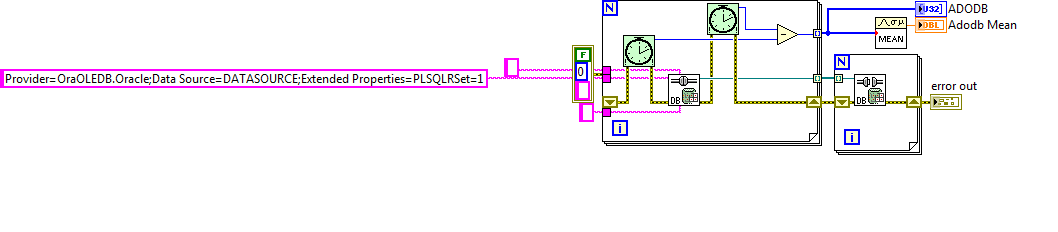
I think I have found a fundamental issue with the DB Toolkit Open connection. It seems to not correctly use connection pooling. The reason I believe it's an issue with LabVIEW and ADODB ActiveX specifically is because the problem does not manifest itself using the ADODB driver in C#. This is better shown with examples. All I am doing in these examples is opening and closing connections and benchmarking the connection open time. Adodb and Oracle driver in LabVIEW. ADODB in C# namespace TestAdodbOpenTime { class Program { static void Main(string[] args) { Stopwatch sw = new Stopwatch(); for (int i = 0; i < 30; i++) { ADODB.Connection cn = new ADODB.Connection(); int count = Environment.TickCount; cn.Open("Provider=OraOLEDB.Oracle;Data Source=FASTBAW;Extended Properties=PLSQLRSet=1;Pooling=true;", "USERID", "PASSWORD", -1); sw.Stop(); cn.Close(); int elapsedTime = Environment.TickCount - count; Debug.WriteLine("RunTime " + elapsedTime); } } } } Output: RunTime 203 RunTime 0 RunTime 0 RunTime 0 RunTime 0 RunTime 0 RunTime 0 RunTime 0 RunTime 0 Notice the time nicely aligns between the LabVIEW code leveraging the .NET driver and the C# code using ADODB. The first connection takes a bit to open then the rest the connection pooling takes over nicely and the connect time is 0. Now cue the LabVIEW ActiveX implementation and every open connection time is pretty crummy and very sporadic. One thing I happened to find out by accident when troubleshooting was if I add a property node on the block diagram where I open a connection, and if I don't close the reference, my subsequent connect times are WAY faster (between 1 and 3 ms). That is what leads me to believe this may be a bug in whatever LabVIEW does to interface with ActiveX. Has anyone seen issues like this before or have any idea of where I can look to help me avoid wrapping up the driver myself?
- 5 replies
-
- 1
-

-
- connections
- database
- (and 1 more)
-
This may be the difference. I am currently using: vi.lib\addons\database\NI_Database_API.lvlib. This particular project is LV2013, ideally soon to be rolled forward but for now we're stuck with that version.
-
I am running calls to a various stored procedures in parallel, each with their own connection refnums. A few of these calls can take a while to execute from time to time. In critical parts of my application I would like the Cmd Execute.vi to be reentrant. Generally I handle this by making a copy of the NI library and namespacing my own version. I can then make a reentrant copy of the VI I need and save it in my own library, then commit it in version control so everyone working on the project has it. But the library is password protected so even a copy of it keeps it locked. I can't do a save as on the VIs that I need and make a reentrant copy, nor can I add any new VIs to the library. Does anyone have any suggestions? I have resorted to taking NIs library, including it inside my own library, then basically rewriting the VIs I need by copying the contents from the block diagram of the VI I want to "save as" and pasting them in another VI.
-

Slow Index Array of Classes
GregFreeman replied to GregFreeman's topic in Application Design & Architecture
Well...didn't fix it per se. But, we did a build WITHOUT normalizing the string array (i.e. no code changes) and it's using drastically less memory in the EXE than the dev environment....We're talking like 600 mb of memory usage instead of 2.5 gb. My guess now is having debugging on in some of these VIs is causing issues in the dev environment. Probably copies everywhere. Either way, normalizing things was a much more memory efficient way of doing this and is a needed improvement. Rather than have 24 classes each with 80k strings, many of which are duplicates, we have 24 classes each with about 2k strings, and we have 80k integers that point to an index from that string array. As much as I'd love to dig into the LabVIEW memory manager to truly understand what's happening in the dev environment (not), I am just going to put this in the "no longer a problem" column and move on. -
Slow Index Array of Classes
GregFreeman replied to GregFreeman's topic in Application Design & Architecture
Alright, I rolled back to a "bad version", I grabbed this snippet off the idea exchange and I'm going to run it on all my classes. I'll see what happens... -
Slow Index Array of Classes
GregFreeman replied to GregFreeman's topic in Application Design & Architecture
I normalized my data but was still seeing awful use of memory. Upwards of 3 gb, and I would randomly get a copy that would give me an out of memory error. So, i went into my project settings, unmarked everything that had compiled code separated. Cleared compiled object cache. Did a save all. My memory usage has dropped from 3gb with tons of seemingly unnecessary copies to 1 gb just by doing this. I have on and off seen some very bizarre issues with classes and separate source from compiled, and even with that setting I still get lots of dirty dots anyways which isn't buying me much. I think I'll be staying away from it in the future. -
I have an array of classes, let's call the object TestPass, of size 1 (but it is an array because it can scale out to multiple test passes). In this class, there is one other nested class which is not too complex, then various numeric and string fields to hold some private data. There is also an array of clusters. In this cluster there is a string, two XY pair clusters, and an integer. Not very confusing. This array of clusters gets fairly large, however, upwards of 80-100k elements. What I am finding is when I index the array of pass classes it is crazy slow. On the order of 30 ms. Doesn't seem like much, but we are indexing the array in our method to "Get Current Pass" which is used in various places throughout our code. This is adding potentially hours to our test time over the 80k devices we are testing. So, I started digging. When I flatten the class to a string and get the length, it's 3 mb. But, when I run the function with the profiler is is allocating close to 20 mb of memory! My gut feel was that the string is causing the issues. So I removed the string from the cluster and the index time went to 0 ms. Luckily we can normalize a bit and pull the strings out of the cluster since a lot of them are duplicates. But it makes our data model a bit uglier. Has anyone seen these kind of performance issues before? I saw them in 2013 and 2017.
-
Decouple UI and application core - need advice
GregFreeman replied to candidus's topic in Application Design & Architecture
While we're on the user event bug train, I have seen this bug also manifest itself in the form of user events where I start getting bizarre coercion dots in my event cases and types not updating/propagating until I do a save all. It has resulted in "phantom time" being added to execution of subVIs where I benchmark around a VI that takes say, 400 ms to execute, but if I benchmark around all the code inside the VI it takes 50ms. I lose 350 ms in the ether. -
Nope, but that is a good idea. Working on getting that set up now. Don't know if it makes a difference but here is the output from the bottom of the lvlog.txt file. <DEBUG_OUTPUT> 9/23/2017 4:20:51.818 AM Crash 0x00000000: Crash caught by NIER File Unknown(0) : Crash 0x00000000: Crash caught by NIER minidump id: 41eb3397-b106-4d85-a433-2ce31d619f06 ExceptionCode: 0xC0000005 </DEBUG_OUTPUT> 0x30762E76 - lvrt <unknown> + 0 0x30763518 - lvrt <unknown> + 0 0x30079A96 - lvrt <unknown> + 0 0x307F05C1 - lvrt <unknown> + 0 0x308035CD - lvrt <unknown> + 0 0x768F62FA - USER32 <unknown> + 0 0x768F6D3A - USER32 <unknown> + 0 0x768F77C4 - USER32 <unknown> + 0 0x768F788A - USER32 <unknown> + 0 0x3088BDBD - lvrt <unknown> + 0 0x3088C237 - lvrt <unknown> + 0 0x01471B06 - QtManager452_2013 <unknown> + 0 0x670E7251 - NIQtCore_2013 <unknown> + 0 0x00000000 - <unknown> <unknown> + 0 0x00000000 - <unknown> <unknown> + 0
-
Desktop, windows 7. Connected to Oracle 12c database.
-
I have been getting some hard crashes in my built application and I have some strange feeling (although it's just a guess) that it is related to a combination of using the database toolkit in a pool of workers that are launched by the start async call node. Their job is to sit there and monitor a directory then parse data files and throw their contents at the database through a stored procedure call. All my hardware comms (2 instruments) are using scpi commands through VISA GPIB and TCP so I think the risk that those are causing crashes is relatively low. Active X inside a bunch of parallel threads seems far more risky, even though as far as I can tell adodb should be thread safe, and each thread manages its own, unshared connection. These crashes are happening ~once a day on multiple test stations. I have sent the crash dumps to NI but am waiting to hear back. Right now I am grasping at straws because when I look at the dump file it's pointing me to function calls in the lvrt dll which does nothing for me. I am mostly just looking for any debugging suggestions or direction to getting this resolved more efficiently than just disabling code one loop at a time. I'm also curious if anyone has seen something similar. For the time being, I have reduced my number of workers to 1 in case it is a thread safety issue. I have also considered getting rid of that DB toolkit and leveraging .NET, even though I think that is just a wrapper around the same calls. Looking inside the database toolkit VIs alone scares me. FWIW I am using LabVIEW 2013 in this application. Thanks!
-
Is friendship the proper relationship here?
GregFreeman replied to GregFreeman's topic in Object-Oriented Programming
It would actually be a base handler that all the Status Bytes use, there are just one or two scenarios where it would have to be overriden. I could probably do it through class A and maybe I'm overarchitecting it. I am going to review what I have and determine if that's the best way to do it. Thanks! -
I am not sure the best way to handle state in this scenario so I am looking for insight. I have some hardware, call it class A. Class A has some state. I have a status byte handler, call it class B. This status byte handler may be different depending on the command I sent, so I have a few Child Class Status Byte handlers. For example, a status byte may be an error we want to acknowledge, ignore, take some action etc depending on the command that was sent. So, I have set this up so class B can have a HandleStatusByte received method which can be overriden when necessary. But, it needs to set the state of class A. It feels like friendship is the proper relationship to allow the status byte handler method to set the state of the hardware class A. But for some reason I feel like there is a bit of a code smell here. Maybe it's just because I don't use friendship that often and I feel as if I have read some not-so-great things about it in LabVIEW in the past. Maybe I'm wrong? Anyways, what are other's thoughts?
-
launch windows login credential dialog with winAPI
GregFreeman replied to drummaniac83's topic in Calling External Code
You let me down -
Edit: found this in context help: Arrays and strings in hierarchical data types such as clusters always include size information. http://forums.ni.com/t5/LabVIEW/Write-to-Binary-File-Cluster-Size/td-p/3199224 I have a cluster of data I am writing to a file (all different types of numerics, and some U8 arrays). I write the cluster to the binary file with prepend array size set to false. It seems, however, that there is some additional data included (probably so LabVIEW can unflatten back to a cluster). I have proven this by unbundling every element and type casting each one, then getting string lengths for the individual elements and summing them all. The result is the correct number of bytes. But, if I flatten the cluster to string and get that length, it's 48 bytes larger and matches the file size. Am I correct in assuming that LabVIEW is adding some additional metadata for unflattening the binary file back to a cluster, and is there any way to get LabVIEW to not do this?
-
All I needed to know. Thanks!
-
I have a user event that is created in the Exec State Change event in my X Control, if the reference is null. This same user event is destroyed at application shutdown. Otherwise, it should last forever so the X Control works in edit mode as well. This works fine. The one case I can't figure out how to handle is if I unlock my X Control. If I unlock it then apply any changes, the user event refnum goes null. I know this because I added a one button dialog to be displayed when the user event gets created. The fact that it's being created tells me the original refnum no longer exists. But, I never closed the existing user event refnum, so I'm worried I have a memory leak. Is there any good way to capture the X Control going into edit mode so I can destroy the user event refnum in that case as well?
-
I am creating some .mnu files for the palettes programmatically using the Palette API in vi.lib. This all works fine, but what I want to do is add my .mnu files to the palettes without having to copy them all to menus\categories\<some API>. I want them to just stay where they are but have LabVIEW know to look there. I know it's possible because I can edit palette sets and do this manually, pointing LV to my .mnu file on disk whether or not it is in the LV Installation Directory. But, I can't find a way to programmatically tell LabVIEW to add those same menu files. My only option so far is to copy them all to the <LV>\menu\categories\<API> then refresh the palettes. Thoughts?
-
Man up.
-
This. 1000 times, this. Don't compilers like GCC have a ton of command line switch options? Diverging a bit, I would like to have a bunch of options for what is displayed as warnings etc. However, AQ, I'm weary of totally ruling out your suggestion. As things stand now I think breaking code based on a race condition is wrong in my opinion. But if the technology allows it, why not leverage that? I just feel currently it doesn't. I'm sure with lots of new ideas things seem "wrong" because we can't really imagine them. But once they are presented to us and we become used to them, we don't know how we lived without them.
-
LabVIEWs OOP (Think VI server) is nearly perfect IMHO. Incredibly readable and intuitive. LVOOP, however, has plenty of room for improvement. It is important to distinguish between the two. We also get into questions of is LVOOP the problem or is the IDE the problem... ...and here we go....let me just trail off