torekp
-
Posts
216 -
Joined
-
Last visited
-
Days Won
3
Content Type
Profiles
Forums
Downloads
Gallery
Everything posted by torekp
-
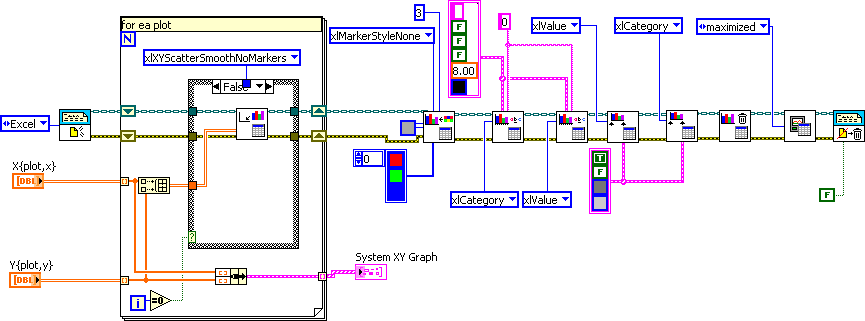
I'd like to make true XY graphs in Excel, where each data series has its own set of X values and Y values. Unfortunately, interleaving rows of X data, Y data, X data, Y data, etc., won't do it: only the first row counts as X data. And "updating graph data" as shown in this block diagram, doesn't work like I'd hoped. That VI should be called "overwrite graph data" not just "update". Am I overlooking something in the Report Generation toolkit? Ultimately, what I really want is to print an XY graph and have the printout scale to fit the page, be oriented nicely, etc. Saving the graph as a .PNG programmatically is cool and all, but the Windows program to view PNGs doesn't print well. Right-clicking the graph and saving to a .BMP leads to similar issues. Right-clicking and exporting the data to Excel allows me to laboriously construct an XY graph data-series by data-series, which then prints nicely. Keyword: laboriously. Suggestions?

-
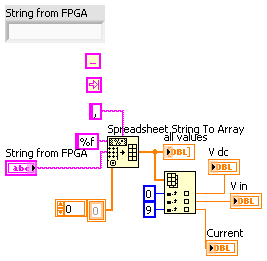
Can you post a (or two or three) typical data string(s)? Usually strings like this have a delimiter, like commas or tabs or spaces, to separate the numbers. So you could do this: I showed the example with comma for the delimiter, but other possibilities are shown above (not wired in). When you create the array type on Spreadsheet String to Array, be sure to right-click the resulting array and select Remove Dimension. Because it sounds like you're getting a 1D array, not a 2D.
-
The github files appear to contain only a vipb file, not a vip file. I was able to build a vip file in LV2015+VI Package Manager, but no DLLs appeared. I tried installing the attached DLL files in the zip into vi.lib/oysstu/... , but when I opened the example VI in the "dense" category, it wanted a different DLL named LabVIEW-libsvm-dense.dll. I tried linking to the DLL from the zip file named LVLibSVM.dll instead, but while the broken arrow went away, it generate a 1097 error on running. (1097=problem in external code linked by Code Interface Node.) This is on Windows XP 32-bit, using the DLLs in the x86 folder.
-
Hello Laely, sorry I didn't see this earlier. I haven't been that regular on lavag.org lately, but I'll try to show up more often for a while. I'd be happy to help, but I've only been able to make the old interface work, not the one posted by oysstu. If you download from my post#3 in this thread, then extract that zip to any folder (say C:\Laely), then open the VI in the top level folder, it should work for you. Just change the start path to your folder (e.g. C:\Laely\Color_SVM_3d Folder\Color_SVM_3d Folder\data) before running. The code is written in LV 8.5. Press the buttons Read, Make Model, View Model, etc. in order. When you Read (the data) select the file AsandBs.txt. A popup VI will ask you to name the two categories - put any names you want. If you want to make your own data file, look at the format of AsandBs.txt. The category goes in the first column. The classification must be binary; only zero vs nonzero in the first column will make a difference.
-
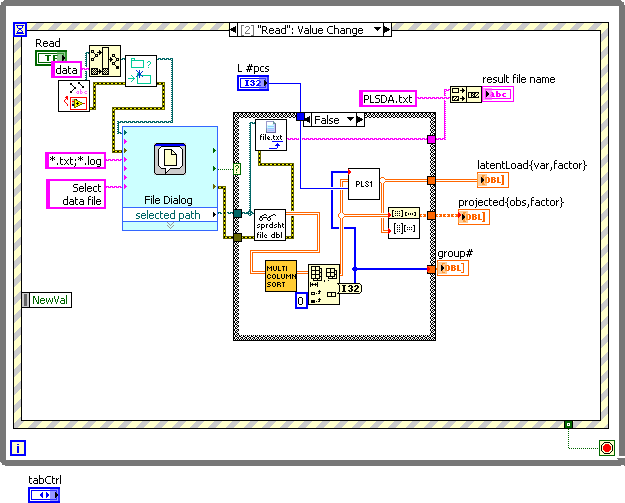
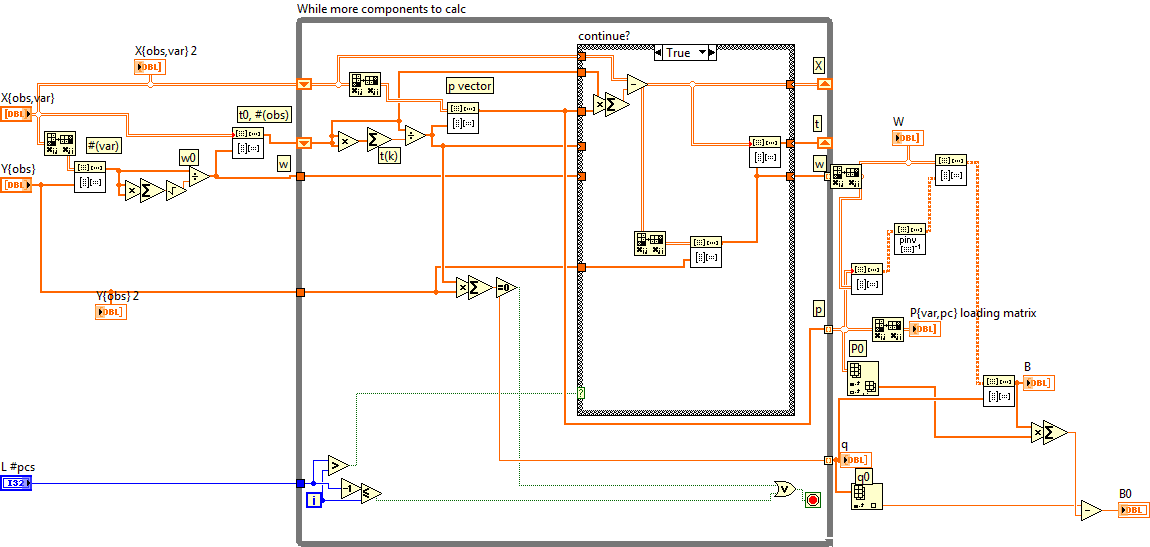
The above PLS code has been corrected for one error. Below I attach the one corrected VI. Other errors might remain. PLS1.vi
-
Thanks oysstu. I'm having the same problem as zhengenhao2. Trying to use one of the Example VIs, it asks me to locate LVlibSVM.dll, but no such file seems to exist. This is for 32-bit Labview 2014. The default path where it tries to look, is in the folder that contained the VI Package Builder, in a subfolder called .Labview - note the dot. No such subfolder exists.
-
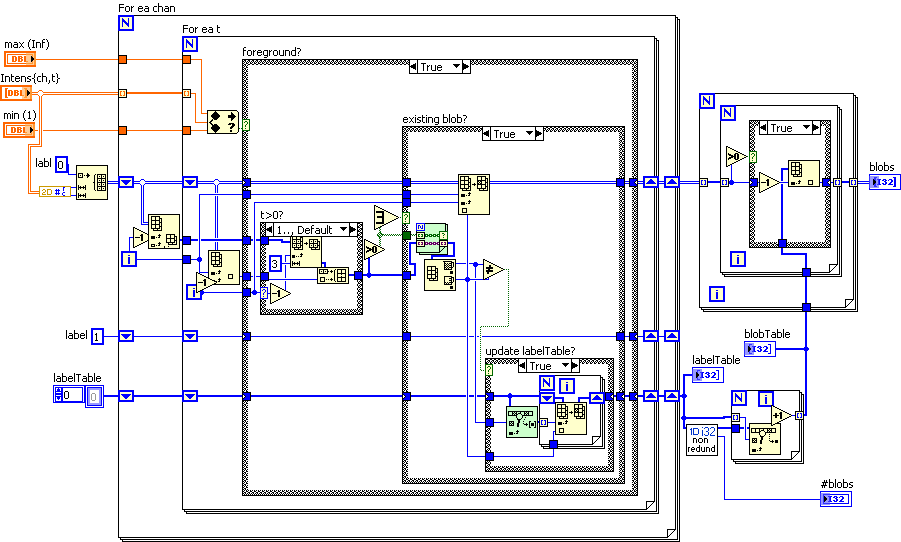
In case this is useful to anyone else who is also too cheap to spring for Machine Vision... I implemented a simple blob finding algorithm based on Blob Detection - The Lab Book Pages. It takes a 2D array of DBL, which should be easy to create from any monochrome image. You can set a range of values to count as "foreground"; the default is 1 to +Inf. I use an intensity graph to display the input, which results in an apparent rotation of your image. Mentally rotate the intensity graph 90 degrees to the right, to see your original image, e.g. if you created the data by reading a picture file and selecting one color. The output "blobs" will be oriented like your original image. Values of 0 in the output indicate no blob, i.e. nothing there. Values 1 or greater are the blob numbers, in the order encountered. Labview 2012; OpenG array package required. Use blob_find_DBL.vi by itself (it's in Common\Calculations) or with test_blob_find.vi (in Common\tests, and you will need a PNG file to read). Common.zip
-
- 1
-

-
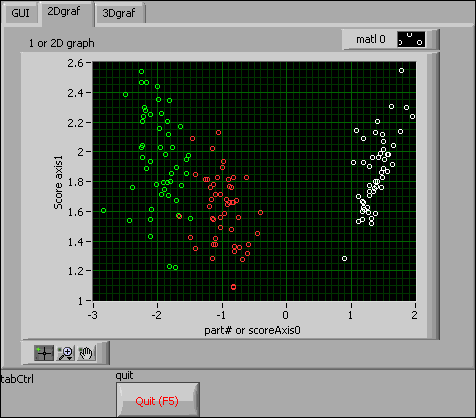
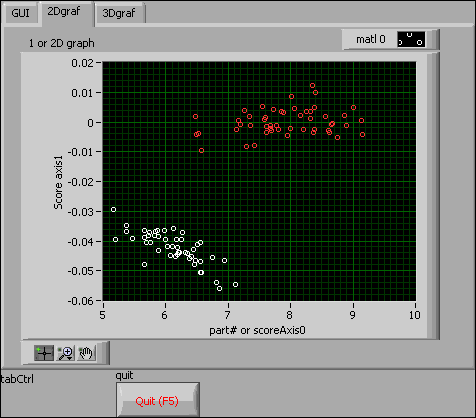
Note: although the PLSDA result for the IRIS data set looks reasonable - it seems to be doing a good job clustering the two categories in different parts of the LatentFactor space - I have had difficulties trying to apply this to my real work. The problem might be in my other, work-related Labview code, but it might be in the above code that I've offered you. If anyone has a Matlab PLSDA code or something that they know for sure works, and if it uses the PLS1 algorithm, and they'd like to compare results to make sure they're identical (or not), that would be nice. I have a vague memory of having done exactly that check with my Multiple Discriminant Analysis algorithm, comparing published results, and seeing agreement. So that one's probably OK.
-
Here's some code I developed for classification problems. The methods used are Multiple Discriminant Analysis, and Partial Least Squares Discriminant Analysis. At least, they're supposed to be. I've tried them and they seem to work, but I offer no guarantees. If anyone finds these really useful, I might try to upgrade them to the point where they'd be fit for the Code Repository. Labview 2012 SP1 Full, requires Matrix/Linear Algebra functions, and many MGI utilities (use VI Package Manager to install MGI utilities). The example data is taken from the classic "IRIS" data set (but for PLS, the Virginica category is omitted: this version of PLS can only do binary classification). Just press "Read File" and then say "Cancel" to get the default example data set for each method. Find some directory somewhere and unzip the zip file there, then open the project. All will be clear, I hope. statsExampl.zip
-

TLB' - Top-Level Baseline Prime Application Template
torekp replied to Norm Kirchner's topic in Code In-Development
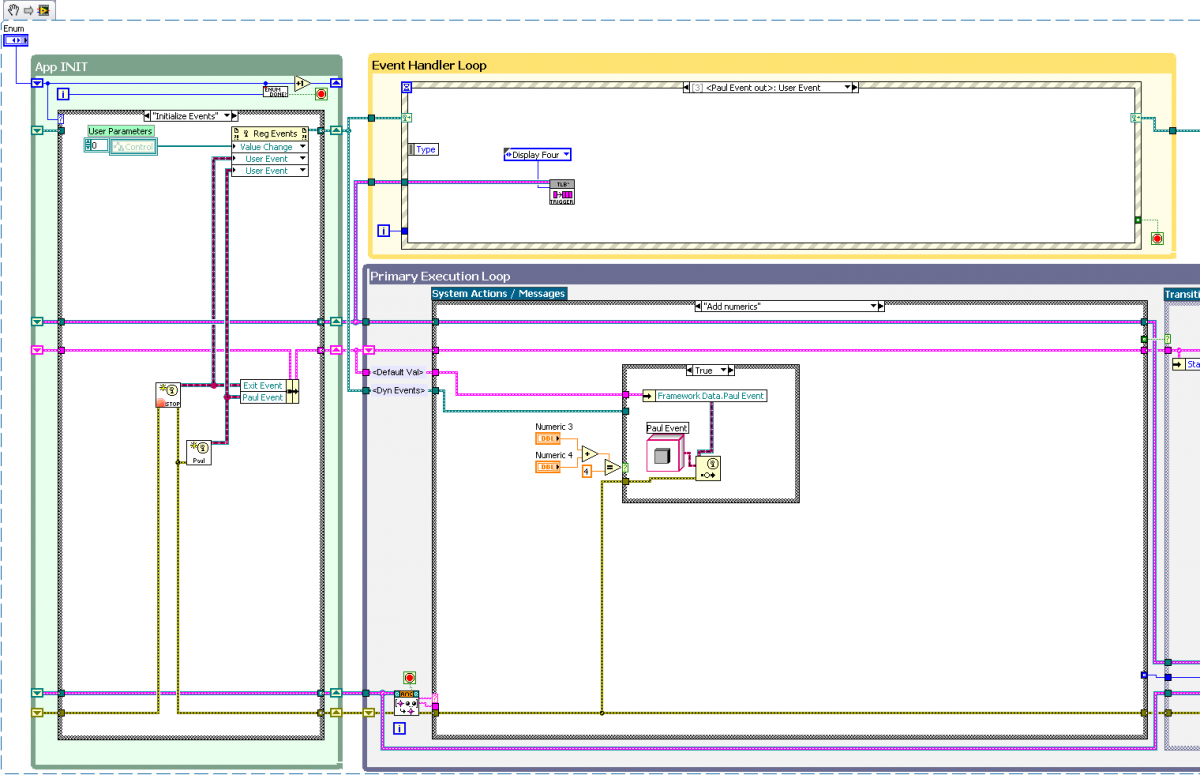
Hello Norm or anyone, I am considering adding more User Events to the Framework Data part of the Shifter. That way, I can make the sequence of actions (in response to some user activity) depend on the outcome of one/some of the early actions. In the snippet below, the user pushes a button to do a calculation (add two numbers). If the result is a particular answer (four), something more happens; if not, nothing else happens. The thing I don't like about what I've done is that there is no way to encode data into my Paul Event. I tried changing the User Event definition to be something other than Generic LV Object, but, short of wiring the User Event wire directly through the Primary Execution Loop (maybe that's what I should do?!) I couldn't do it. I guess what I would do next is add a variant or string to the User Data in the shifter. Then I could put whatever important results I got from the first action(s), into that variant or string. This feels dumb somehow. Please tell me a better way to go.
-
OOPS! My earlier "solution" only works for non-array types. So here is a new solution, in LV2012. The files become a little more verbose, but not too bad. CVT_mgi_convert.vi CVT_read_from_mgi.vi CVT_to_mgi.vi MGI_flt_tag.ctl MGI_signd_tag.ctl MGI_str_tag.ctl MGI_unsign_tag.ctl pt1.txt
- 8 replies
-
- 1
-
-
- globals
- current value table
- (and 1 more)
-
That was easy. (Attachments are Labview 2011; dependencies: MGI Read/Write Anything. Also attached: XML and MGI-formatted files for comparison; I had to rename them in order to attach them.) CVT_to_mgi.vi CVT_read_from_mgi.vi PaulCVT.txt PaulCVTmgi.txt
-
Thanks for the input. I already had installed CVT from reading those threads I mentioned, but I did not think to use it for this relatively simple case. Now that I'm looking at it, it does seem very easy to use. The only downside is the XML files. Usually I put my initialization info into an MGI_Read_Anything type file. The MGI format is much easier for a non-programmer to read (and modify). The obvious solution is, I could write a few little VIs to use the MGI format. I think I will.
-
First off, thank all y'all for schooling me on Data Access Best Practices and FGVs, Action Engines and DVRs. Now let's dumb it down a bit. I want to ask about good(?) old-fashioned native Labview globals. Here's a use case: A control program for an industrial process has 10-20 adjustable parameters (numerics and booleans) on its GUI. These parameters are written once at program start based on values in an INI file, and then an arbitrary number of times thereafter when the user changes them. It is not critical for the process to update the user-changed value at the exact millisecond. So: globals? Or what? How lazy can I be, before the expected value of time and effort goes negative? Let's assume that the control program is subject to revisions such as adding more adjustable parameters. The additional parameters could represent new hardware that has been added, or simply taking advantage of more functions (that we had thought we could just set and forget) of existing hardware.
-
I would really like it if you'd link to that discussion, or estimate about when you posted it. I need to school myself on these topics. I tried clicking on your name and "find content", but you're too prolific.
-
Noob question. I read Adam Rofer's "XNodes - A Crash Course", but I didn't see any guidance on building EXE's from Xcontrol-laden VIs. Can it be done? If so are there any special tricks to it?
-
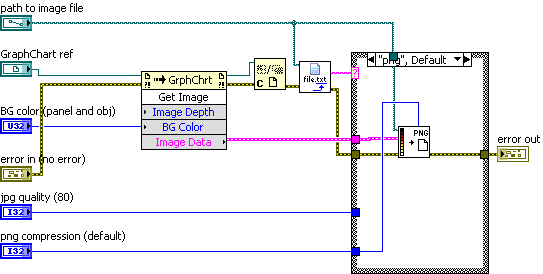
Much nicer! It occurs to me that I do this often enough, I should write a subVI. So here it is. (LV 2012 again) (Edited: I generalized the object reference type to all GrphChrt types.) And below, I'm also attaching a little tester VI to demo it. chart_save_tester.vi chart_save_image.vi
-
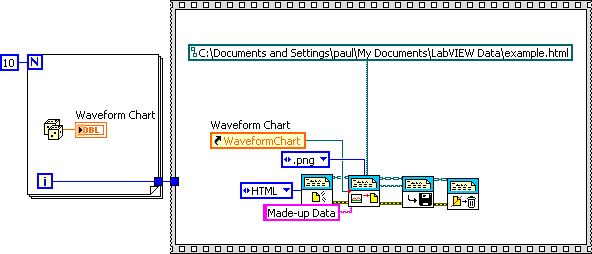
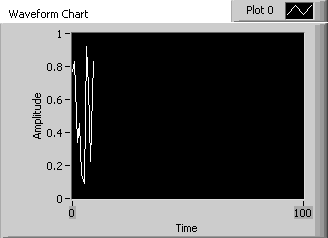
Here's what I usually do And then I look for the png file, and rename that. Here's what I got with this example: The code below is LV2012 chart_save_html_example.vi
-
You didn't provide the subpanel VI.
-
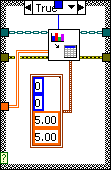
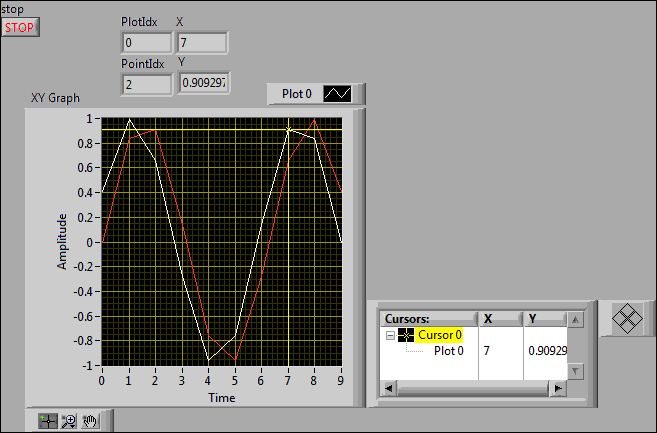
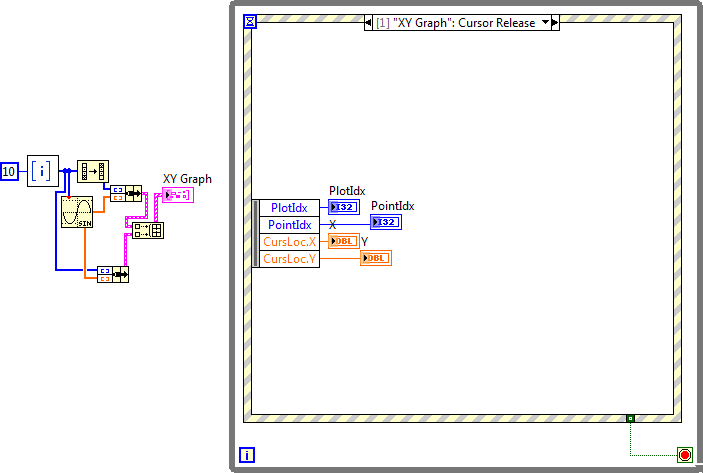
Does this do what you want? Note that I clicked on the 2nd (zero-based; 3rd in normal speak) point of the 0th plot, but I reversed the X array for that plot so it goes 9,8,7,etc. Labview 9.0 xy_cursor.vi array_of_indices.vi
-
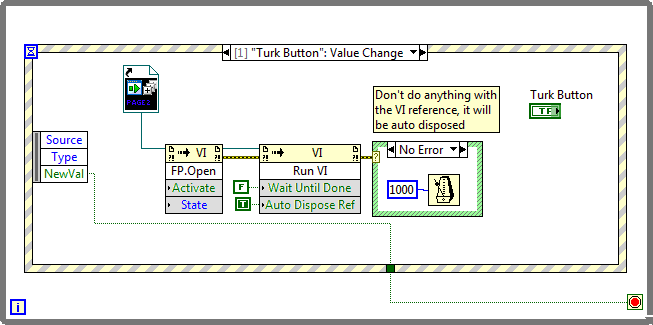
I think this is what you want. In the future when you post here, be sure to include all the subVIs and control typedefs that you use. It will make it a lot easier to help you! Probably why there are no answers til now, yet many downloads of your VIs. I changed the name of your controls from "OK button 2" to "Turkish" or "English" as needed. page1.vi
-
Doh! Never thought of that
-
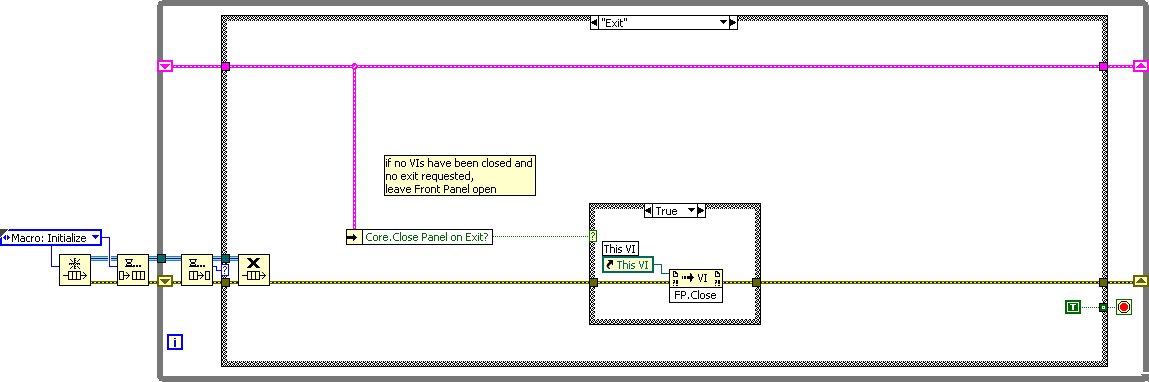
Thanks jcarmody! I have a suggested improvement. I was annoyed by the fact that once I changed the VI to run-when-opened, I could no longer edit the VI - I wanted to edit the VI description. I had to re-download. To make the VI editable, I modified it to use the variable (which you already had in place! nice!) Close Panel on Exit. This starts out False but becomes True in Idle subcases 1, 2, and 3, i.e. if the user does anything. So if the user doesn't do anything and the VI exits on account of being the only one running, then the front panel stays open. And then you can edit it. I put this at the end of the VI description: "To edit this VI, stop all other VIs first before using this one."
-
I had a related problem. When I copied my custom palette from LabVIEW Data2011(32-bit) to LabVIEW Data2012(32-bit), the OpenG palette went away. If I delete LabVIEW Data2012(32-bit)Palettes, I got my OpenG back - but like to have my customized menus too! It seems to be solved now. First, I did Tools->Advanced->Customize Palette and deleted some things that didn't seem to really exist anyway. When I said "save changes" it created LabVIEW Data2012(32-bit)Palettesmenusdefault. Now I copied my 2011 Palettes to a new location and deleted the "default" directory from menus, then copy/merge'd the result into 2012(32-bit)Palettes.
-
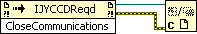
I open and close an activeX reference. (In case it matters, the activeX commands control a Hamamatsu OEM mini spectrometer.) Problem: after the Labview closes the reference, in reality it is still open a little while. If I re-run my VI and thereby try to open the activeX connection while it wasn't yet closed, bad things happen. So, how can I check whether the reference/connection is actually closed? Either this reference specifically, or some way to list all open activeX references, would be cool.