Leaderboard


Popular Content
Showing content with the highest reputation on 06/13/2016 in all areas
-
Version 1.9.1
1,796 downloads
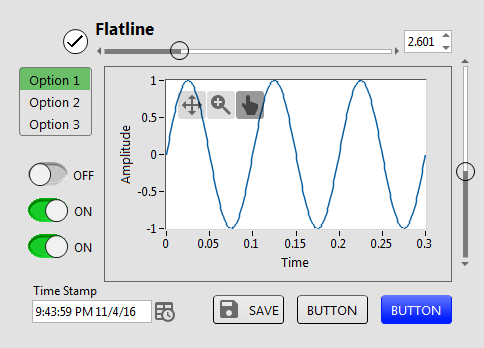
A set of custom controls, following the trend of a more flat UI design. Heavily influenced by Google’s Material Design, though constrained by what can be done with available tools and options in LabVIEW. Uses icons from Google Material Design. — Buttons based on the system booleans (with hover effects). Icons can be added as decals (such as from materialdesignicons.com) — Matched sets of controls for numeric/string/enum/etc., based on Silver controls, but swapping out all ‘chrome’ for simple boxes and lines. — flattened versions of switches/sliders/arrays/graphs etc. Now on the LabVIEW Tools Network JDP Science Tools group on NI.com.1 point -
View File Flatline Controls A set of custom controls, following the trend of a more flat UI design. Heavily influenced by Google’s Material Design, though constrained by what can be done with available tools and options in LabVIEW. Uses icons from Google Material Design. — Buttons based on the system booleans (with hover effects). Icons can be added as decals (such as from materialdesignicons.com) — Matched sets of controls for numeric/string/enum/etc., based on Silver controls, but swapping out all ‘chrome’ for simple boxes and lines. — flattened versions of switches/sliders/arrays/graphs etc. Now on the LabVIEW Tools Network JDP Science Tools group on NI.com. Submitter drjdpowell Submitted 06/13/2016 Category User Interface LabVIEW Version 2011 License Type BSD (Most common)1 point
-
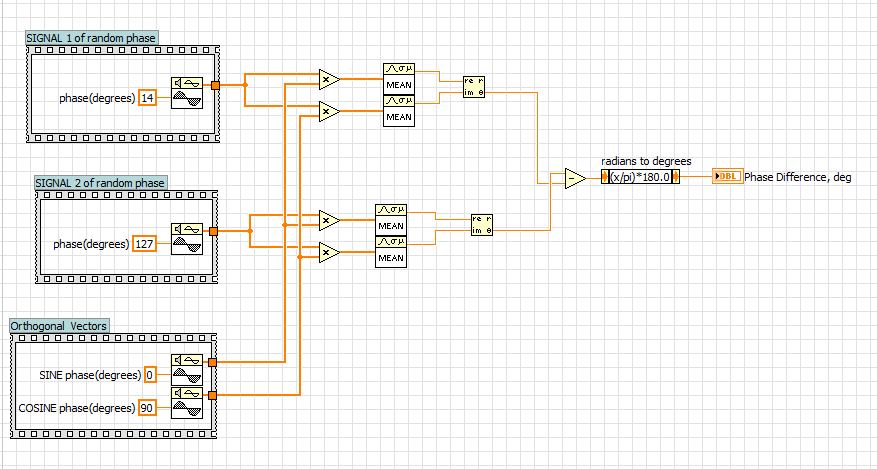
See image and attached code. This works great for simple signals and when you know the frequency of the signals coming in. If you don't know this or the signals coming in aren't simple sinusoids, then the game changes a bit. I thought I would start with this though. Good luck, Norm Code to post.vi
 1 point
 -
Using something beyond its original purpose can give rise to monstrosity as well as innovation, and being able to tell the difference is very valuable.1 point
-
To further pique your interest in macros, there is a new one in LabVIEW 2016 / User Libraries / macros called Norm.vim. It is not meant to be rigorous from a mathematical perspective (it's just my best guess) but rather to illustrate a new (experimental) structure, a variant of the Diagram Disable Structure, called a Type Enabled Structure. It has some interesting properties when used within a macro. Here is how it works. When an instance of the macro is inlined and types are propagated to the inputs, each subdiagram attempts to propagate types; the first subdiagram (in subdiagram order) which successfully propagates types without any errors is enabled and all the others are disabled; the enabled subdiagram is the one which is compiled for this instance of the macro. The new structure is not in any palette yet, nor is there any documentation. It isn't quite ready for prime-time, but you can copy it from Norm.vim and experiment with it and give us feedback.1 point
-
Well. you are sending a waveform as a block (array) of data which has a fixed dt so you need to know the start time, Prepend the date/time to your double array and read it the other end to set your x axis start. You can then compare that value with the time you received it to get a rough latency of transmission.1 point
-
Please forgive me if I've misunderstood you, but I feel that you are presenting an XY Problem here (see http://xyproblem.info/ ) To help us identify how to help you properly, please describe your project in more detail. Specifically: What is the name of your project? (If your project doesn't have a name, tell us the name of your unit/subject/course) Why are you required to use OPC UA? What does your professor want you to learn? (This really doesn't make sense to me, because OPC UA is not really designed for transferring waveforms) Why do you want to run the server "as fast as possible"? Who does the sampling? The server or the client? The time difference and phase difference is mainly due to the lag in transferring the data from your server to your client, right? Are you interested in measuring that lag? Sampling rate is only relevant when you convert a physical (real) signal to a digital signal. OPC UA only transmits digital data; it does not do any conversion. Why do you think there will be noise or change in frequency? OPC UA transmits digital data. As long as the client doesn't lose any part of the data, the data will be received perfectly at the other side, without noise. You need 3 things: First, you must make sure you understand the types of comparisons that you want to do. This is the theory you learn from your professor and/or your textbooks. Next, you must identify algorithm for performing your comparisons. There might already be an algorithm available in your textbooks, or you might need to think of one, or you might be able to ask someone who knows. Finally, you must write a program that uses that algorithm to perform your comparisons. We can help you with #3 quite easily (after you finish #1 and #2), but I'm not sure if we can help you with #1. Forget about LabVIEW programming for now. Consider these sine waves: What kind of comparisons do you want to do on them? Which differences are you interested in?1 point
-
Some more progress on this project I wanted to share. You can now drag out range based markers to overlay them on a graph. point and line markers are all supported as well.1 point