Mark Balla
-
Posts
607 -
Joined
-
Last visited
-
Days Won
41
Content Type
Profiles
Forums
Downloads
Gallery
Everything posted by Mark Balla
-
My story made NI'sInstrumentation Newsletter Q2 2010 See page 24
-
How about this? Create a basic number tester. <object id="scPlayer" width="718" height="457"> <param name="movie" value="http://content.screencast.com/users/mballa/folders/Jing/media/6b5494b7-6ddd-49af-b16d-39be72d51226/jingswfplayer.swf"></param>'>http://content.screencast.com/users/mballa/folders/Jing/media/6b5494b7-6ddd-49af-b16d-39be72d51226/jingswfplayer.swf"></param> <param name="quality" value="high"></param> <param name="bgcolor" value="#FFFFFF"></param> <param name="flashVars" value="thumb=http://content.screencast.com/users/mballa/folders/Jing/media/6b5494b7-6ddd-49af-b16d-39be72d51226/FirstFrame.jpg&containerwidth=718&containerheight=457&content=http://content.screencast.com/users/mballa/folders/Jing/media/6b5494b7-6ddd-49af-b16d-39be72d51226/2010-05-25_0704.swf"></param> <param name="allowFullScreen" value="true"></param> <param name="scale" value="showall"></param> <param name="allowScriptAccess" value="always"></param> <param name="base" value="http://content.screencast.com/users/mballa/folders/Jing/media/6b5494b7-6ddd-49af-b16d-39be72d51226/"></param>'>http://content.screencast.com/users/mballa/folders/Jing/media/6b5494b7-6ddd-49af-b16d-39be72d51226/"></param> <embed src="http://content.screencast.com/users/mballa/folders/Jing/media/6b5494b7-6ddd-49af-b16d-39be72d51226/jingswfplayer.swf" quality="high" bgcolor="#FFFFFF" width="718" height="457" type="application/x-shockwave-flash" allowScriptAccess="always" flashVars="thumb=http://content.screencast.com/users/mballa/folders/Jing/media/6b5494b7-6ddd-49af-b16d-39be72d51226/FirstFrame.jpg&containerwidth=718&containerheight=457&content=http://content.screencast.com/users/mballa/folders/Jing/media/6b5494b7-6ddd-49af-b16d-39be72d51226/2010-05-25_0704.swf" allowFullScreen="true" base="http://content.screencast.com/users/mballa/folders/Jing/media/6b5494b7-6ddd-49af-b16d-39be72d51226/" scale="showall"></embed> </object> This is a test I used to give potential employees. Its around a CLAD level program. Hope this helps. Mark
-
Due to the new forum upgrades the requirements for the LAVA CR have been updated. See Here
-
I moved it to the Quick Drop Plugins category as requested. Mark
-
Certified 5-4-2010 Placed in LabVIEW OOP Catagroy
-
Certified 4-28-10
-
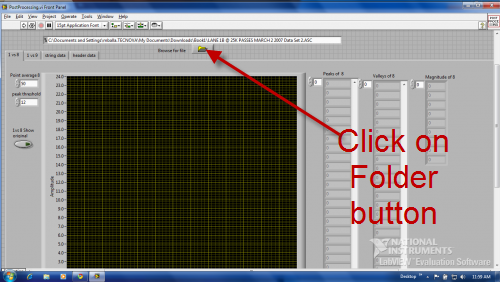
If you click on the folder button you will be able to select the file to be analyzed.

-
You need to provide more information (Data, Screenshots, program settings.....) before I will be able to help you.
-
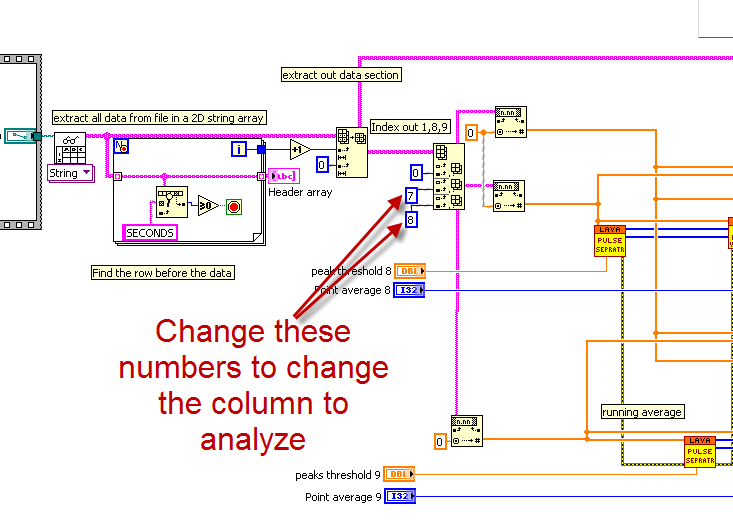
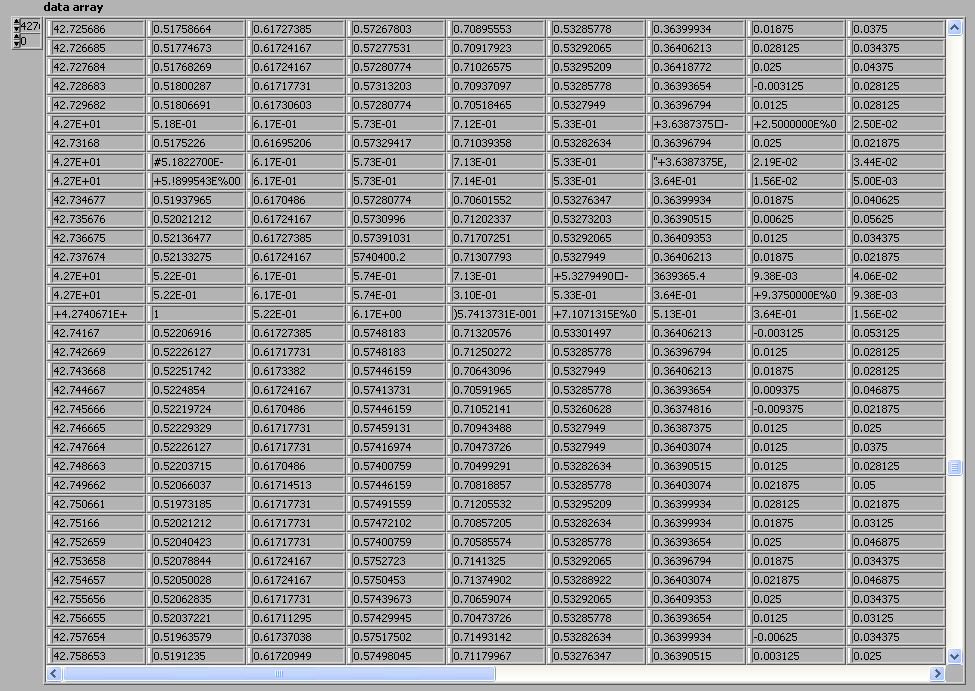
To change the column that you graph is as easy as changing the column index numbers shown below.
-
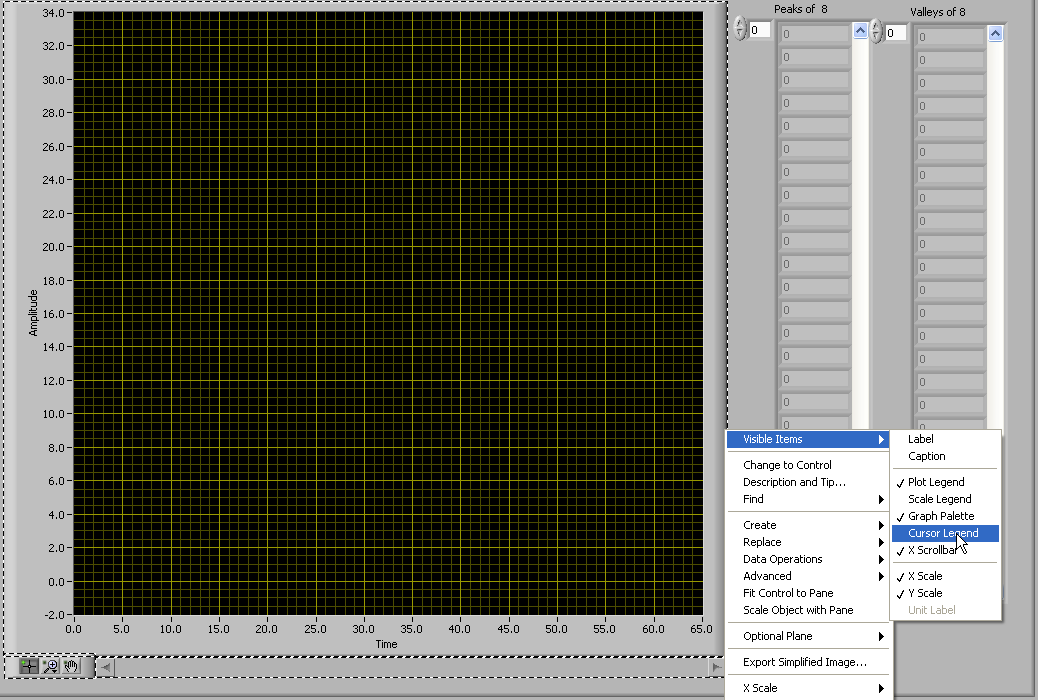
When you say base line I am assuming that you are referring to the part below the threshold. It's not straight because the data is not "straight" the lower part of the waveform is averaged from the original data. You will have to explain more why the lower part needs to be straight. If you right click on the graph and go to Visible Items then Cursor Legend. You will see a new window. you can add cursors and then place them on the graph where ever you want. Mark
-

Anyone attending the FRC Championship in Atlanta next week?
Mark Balla replied to xtal's topic in LAVA Lounge
Good luck to your team xtal. What's your team's number and name? Can you post links to your teams website or youtube videos? -
Great, now we are starting to get better information. Here is version 2 The program will separate the high values from the low values. values above the threshold input will be considered high and below will be low. Only low values will be averaged high values will not be modified. Here is the graph of the original waveform And this is the new modified one. Try this out and let me know. Please give us as much detail as you can explaining any issues you still have Mark. LAVA Guidence MB help v2.zip
-
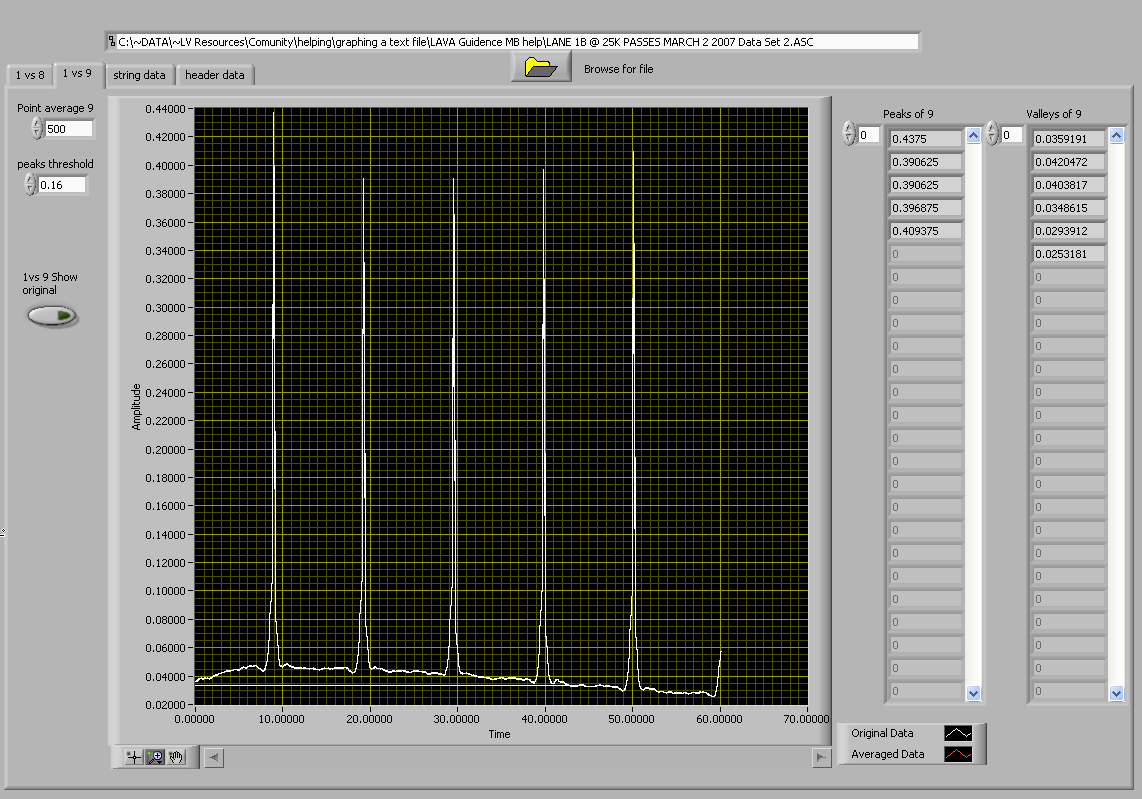
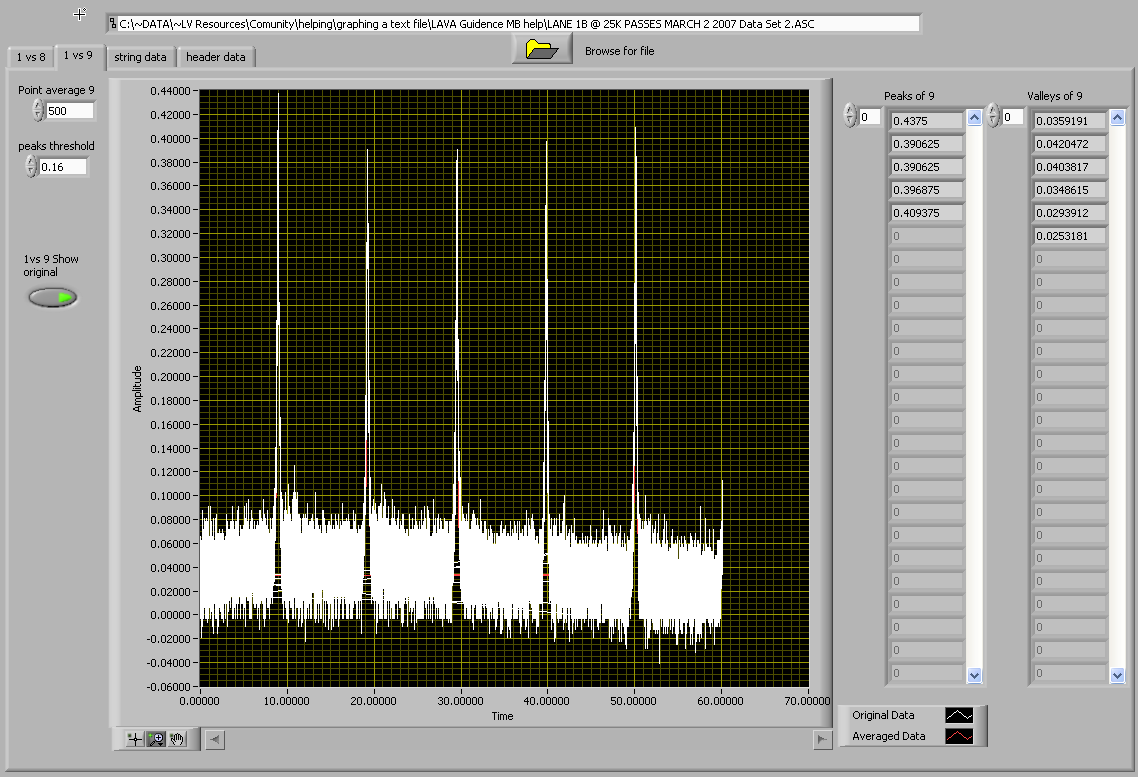
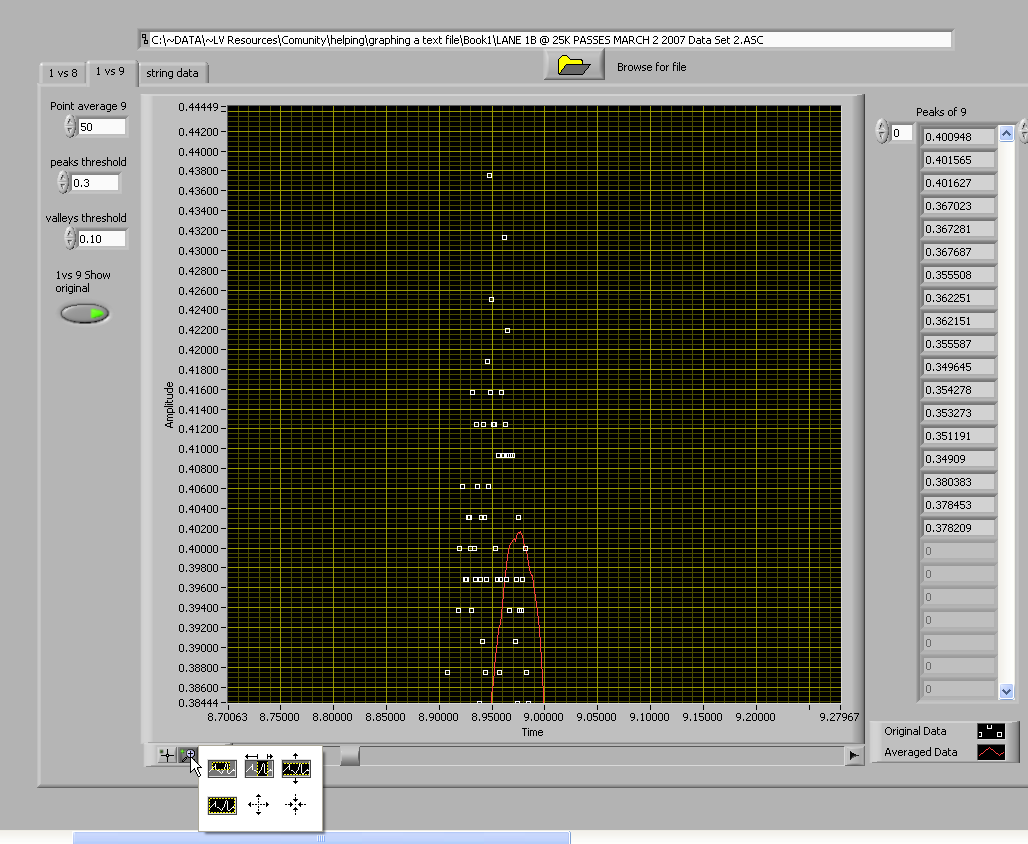
How do we know how many points to average at one time. do we average 5 or 50 or 5000? The more points that we average the more the peak will be reduced in value. Averaging 5 points will give a different peak value than averaging 50 points. in the picture above the original waveform peak will be .431 if we average 50 points the peak will be .4016 How do you know which is correct? Do you even need to do an average. Can we just take the original and find the peaks of each pulse?
-
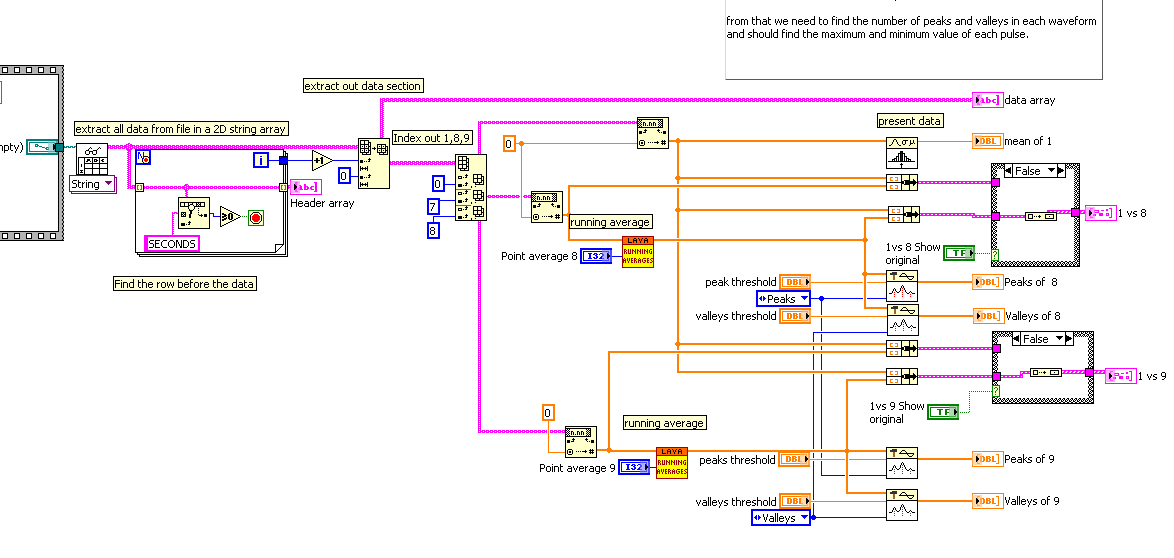
I think at this point we seem to be at a loss as to how to help you any further. Can you please take the time and write out a detailed explanation of the project and what the ultimate goal is for the data will be. Beacause of the language barrier you are going to have to be careful to define each item in detail. Base pulses, actual peaks, particular time period, can mean many things to many people. Here is a list that I need to help further. What is the final data going to be used for? What does the data represent? Why do you want to average / smooth the data? What does the peak and valley data tell you about the waveform? How do you know if the program is doing the right thing? Please write as much detail as you can about your requirements so we can assist you further.
-
Color detection in IMAQ Vision
Mark Balla replied to lovemachinez's topic in Machine Vision and Imaging
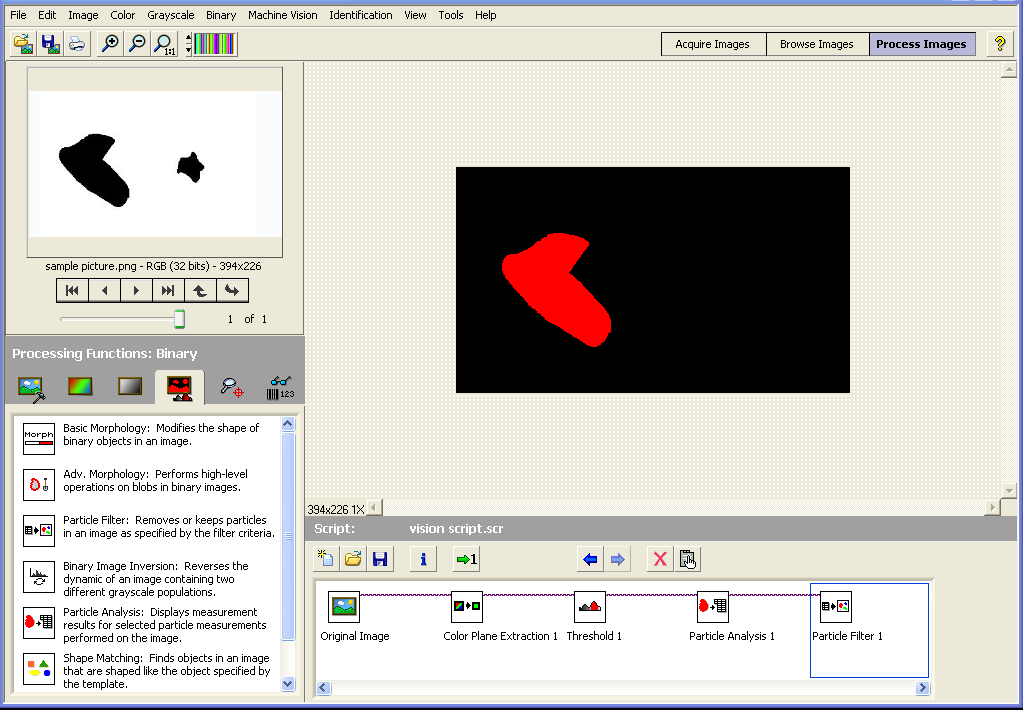
The function you are looking for is called "Particle Filter" but before you can use it you need to convert your image to binary. The image below shows how it can be done in vision assistant. If the image is color you will have to extract a color plane then do a threshold. Here is the script and the vi that vision assistant created for me blob filter.zip Good luck
-
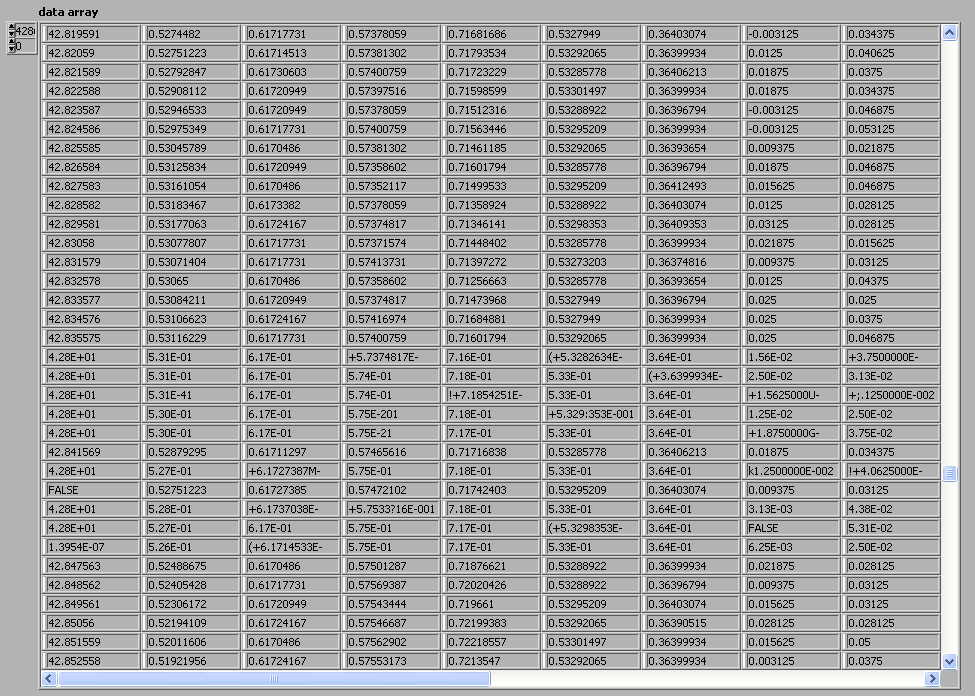
Based on your description here is what I came up with. Hopefully this will get you further along than you were. This program has the ability to change the number of points you average and allows you to see the original and averaged waveforms on the same graph. As you can see below averaging 50 points reduces the amplitude of the peaks so you will need to figure out what the best settings are for your analysis. The data in your ascii file is corrupt in 2 places shown below. This will cause odd behavior in your graph plots I hope this helps. Finally here is the location to signup for LAVA Premium Membership http://lavag.org/index.php?app=subscriptions Let me know if you have any questions about the code or any problems becoming a Premium Member. Mark LAVA Guidence MB help.zip
-
How about this. The members of LAVA help you with your LabVIEW program. If it works to your liking you take the money and become a Premier member and donate the rest to the LAVA fund? How soon do you need this completed?
-
Approved 3-23-2010
-
[CR] Swap Terminals RCF Plugin 1.0.2-8
Mark Balla replied to gb119's topic in Code Repository (Certified)
Certified 3-15-2010 Placed in LabVIEW API>>JKI Right-Click Framework Plugins -
[CR] FP SubVI Fixer ver 6 LV 2009
Mark Balla replied to Mark Balla's topic in Code Repository (Certified)
1: Using the By Arrangement function http://www.screencast.com/t/jrvrm5l1eu 2: Using Settings http://www.screencast.com/t/hU5E0eEI 3:Using Wire by Pairs function http://www.screencast.com/t/4eUSYTMfc97 -
3,061 downloads
Author: Mark Balla LAVA Name: mballa Contact Info: Contact via PM on lavag.org LabVIEW Versions: LabVIEW 8.2, 8.5, 8.6, 2009 Dependencies: None Description: The FP SubVI Fixer is a set of VI Server and Scripting function that will automatically wire the FP controls and indicators to the connector pane and will arrange the FP items based on a configuration setting. Past Deveopment of this tool can be found here Installation and instructions: Place the three items (FP FIX SUBVI, _FIXER Subvis Main, _Subvis for FIXER) in the \National Instruments\Labview 8.x\project folder In the LabVIEW development environment open a vi that needs it front panel fixed. select tools then the FP FIX SUBVI item. the fixer will popup breifly and then be minimized. Select the vi to be fixed. Press Ctrl-Shift-Space to bring up the FP Sub VI Fixer. Click on the various buttons to fixe the subvis front panel. Examples: Please view the following screencast videos to see how it works. Acknowledgements: Thanks to Aristos Queue and PJM_labview for helping me take this to the next level. Version History: v6.0.0: Initial release of the code. 1 Using the by arrangement function http://www.screencas...cc-235e8cca0cd1 2 Using Settings http://www.screencas...3b-37fe090f1eb0 3 Using the by Pairs function http://www.screencas...34-47266a6860a3 -
I didn't have time to look at your code but the "Draw Graph with Events.vi" found in the example finder sounds what you are looking for.
-
Terminating Producer Consumer Loops
Mark Balla replied to AlexA's topic in Application Design & Architecture
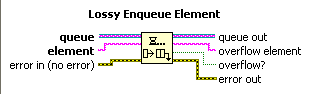
The Lossy enqueue has no timeout input.
-
Terminating Producer Consumer Loops
Mark Balla replied to AlexA's topic in Application Design & Architecture
To clarify the timeout is the amount of time the enqueue will wait for a spot to become open in the queue. For queues that have no size limit it's value has no meaning. a timeout of 0 simply means the node will not wait if the queue is full and will discard the input element. Mark -
Terminating Producer Consumer Loops
Mark Balla replied to AlexA's topic in Application Design & Architecture
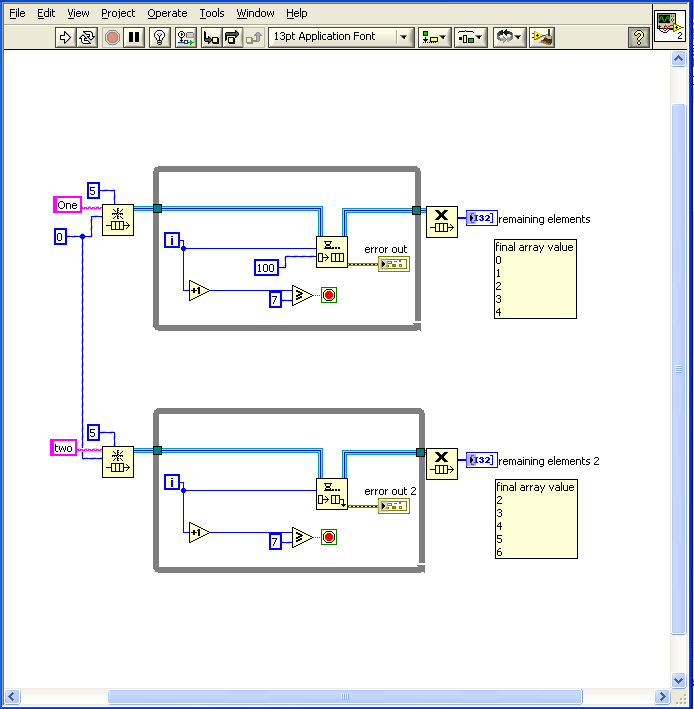
Looking at your posted code the error checking case structure is insignificant compared to the other nodes. I doubt you could even measure the difference. The obtain queue node has a max queue size input. If this is set to -1 the queue can be as big as your RAM will allow. The data in the queue will only be lost if you release the queue before you dequeue all the items. If you input a non negative number to the max size then you have two options. If you use the normal enqueue and the queue is full the node will wait until it has timed out and then discard the input element. If you use the lossy enqueue the node will push out the oldest element. two queues.vi