Mark Balla
-
Posts
607 -
Joined
-
Last visited
-
Days Won
41
Content Type
Profiles
Forums
Downloads
Gallery
Everything posted by Mark Balla
-
Ok this blew me away. How about making Free LabVIEW videos like the Guy from Khan Academy
-
Sorry didn't do the source distribution correctly. Try this one Version 4.1 9-25-2010.zip
-
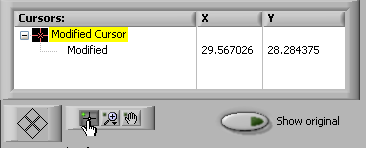
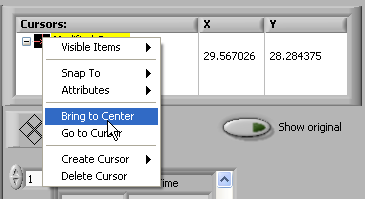
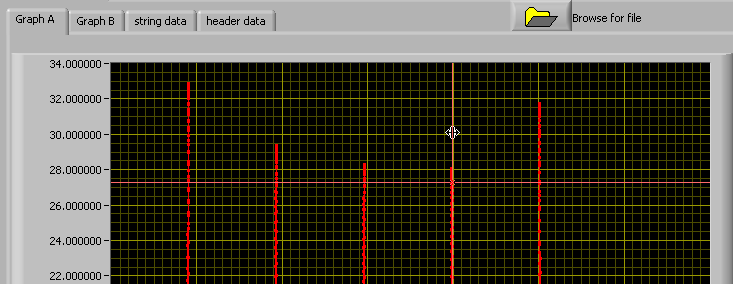
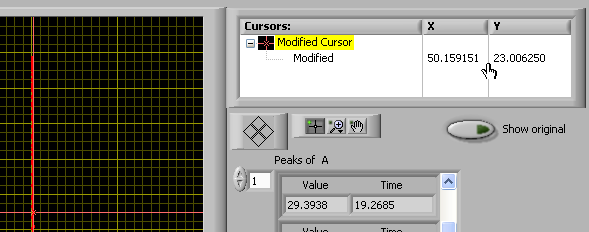
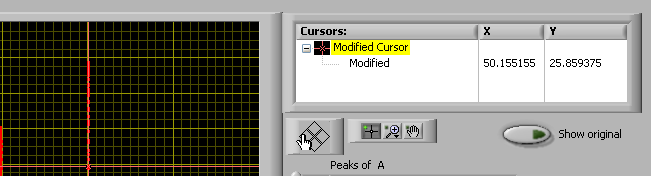
I do not understand what you want me to do here so I will leave the calculation the same as before. I've added two new features to this code. 1: The peak and valley arrays are combined with time so each peak point you can see the value and time in the array. 2: I have added cursors to each of the graphs. This will allow you to drag the cursor around to any point you wish. To use the cursor select the cursor tool (see below) right click on the cursor and select bring to center Place your mouse over the cursor line until you see the double arrow Move the cursor to where you want. and the value and time will show in the cursor box If you want to move the cursor one point at a time click on the square arrow buttons Version 4 9-25-2010.zip

-
I would like to someone build a program from scratch using their chosen framework. Kind of like a statemachine vs statemachine but at a more detailed level. Niweek presentations. I have AQs if you want it. usergroup presentations. Mark
-
I'm back. I only have access to LAVA via my phone so this will be short. The sharp edge is due to the fact that all data below the threshold is set to the same value. This is what makes the data flat or smooth. What is the reason to round the sharp corners when the smooth data has no meaning. I thought you only cared about the peaks. Have you changed your mind and do you now want to go back to an average or mean of the data below the threshold?
-
Certified 9-18-2010 Placed in the JKI RCF category.
-
Here is what I have so far. I took the calculations and put them in a JKI state machine. I also added the menu functions you asked for. I will try and add the graph annotation and comment on the look of the curves in a later post. Version 3 9-16-2010.zip
-
Went to our first Northern Illinois User Group meeting in a while. I made sure more users know about LAVA, JKI State Machine, Norms TLD and my icon editor. Life is good.
-
Human machine infinite loop. I have to design a robot to act like a human to test a droid so people won't be upset
-
 Certified 9-15-2010 Placed in Quick Drop Plugin Category.
 -
Certified 9-15-2010 Placed in General Category.
-
Certified 9-14-2010 \ Placed in Remote Control, Monitoring and the Internet
-
Fall pumpkin picture contest. Must include a loved one or friend with pumpkin. Biggest one wins. #pumpkinpicture http://yfrog.com/bhtp7qj
-
[Discuss] TLB - Top-Level Baseline
Mark Balla replied to Norm Kirchner's topic in Code Repository (Uncertified)
My turn. I have not seen a nested event structure used before. How does the event structure inside an event structure work? When do you put an event in the the innermost one and when do you create one in the outermost? MArk -
Playing farmer today picking potatos.and beans with the girlscouts to give to the food pantry
-
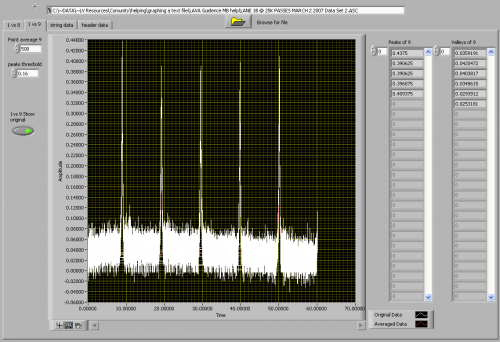
Here is the newest version. I want to get the data manipulation right before we put this code in a state machine and make it pretty. The new code has the following additions. Threshold is calculated by adding 3 Standard Deviations to the mean. (Thanks ShaunR) the threshold is then set and values above are not changed and values below are replaced with the mean value to make values below the threshold look flat or "neat" all of these values are averaged and replaced with the mean value. All corrupt rows with bad time data are stripped from the array. Let me know if the data looks the way you want it. Mark Version 2.1 9-4-2010.zip
-
Version 2.0 8-31-2010.zip Here is the latest it only does the values below the threshold differently. Please send me a data file with 6 peaks so I can continue with the rest of the code. I will PM you with my email address if you can't post it here.
-
Certified 8-30-2010 placed in Remote Control, Monitoring and the Internet
-
Certified 8-30-2010 placed in Remote Control, Monitoring and the Internet
-
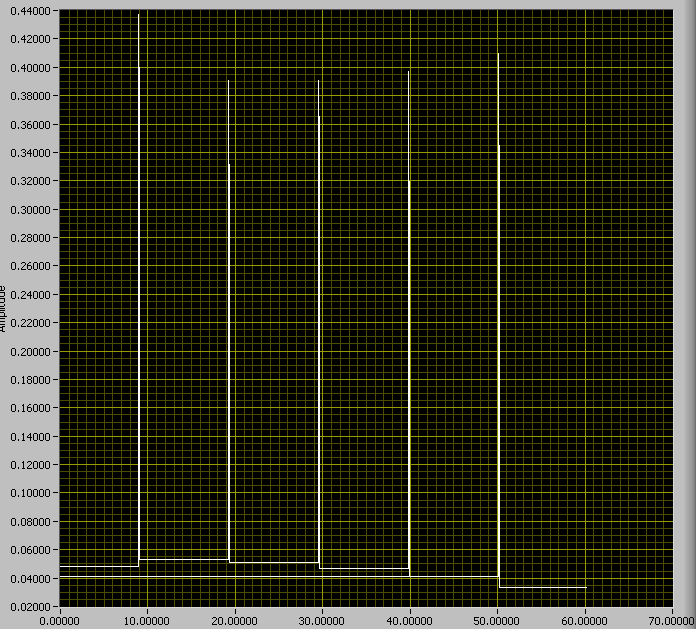
Avinashgogineni can you post the data file for this graph so I have it to work with? I still don't know exactly what a "neat curve" means. It seems like you want a straight line for the data below the threshold. So I will take all the data below the threshold and calculate its mean value then replace each point with the mean value. The result will look like this. Thanks ShaunR I'll use this method to set the threshold.
-
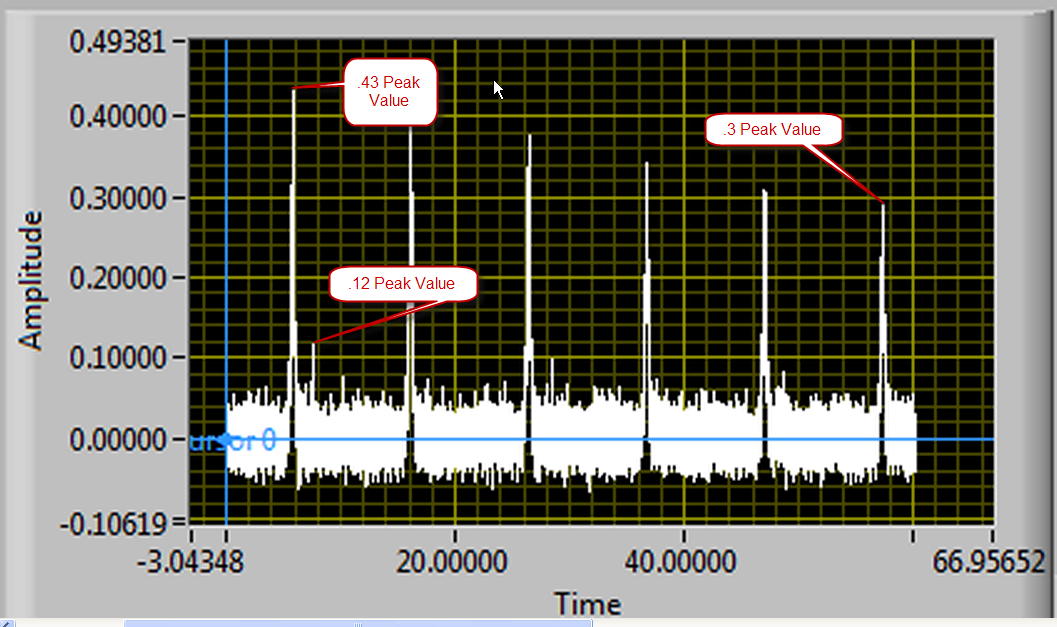
Is 6 peaks always the correct answer? The original data that you sent me only had 5 relative large peaks. The threshold was designed to separate desired peaks from noise. I look for 20 points above the threshold. If I get 20 or more points above the threshold then it is defined as a spike. If this doesn't work for you then you need to explain a better method. In the picture above we need to separate the noise spikes from the actual spikes. as you can see there is only a .13 difference between the highest and lowest spike and there is a .18 value difference between a noise spike and the lowest actual spike. Anyone out there have a better way of separating the noise from the spikes?
-
School starts tomorrow. Taking the girls on a fun dinner date. Tia appetizers, Boston market then baker square for pie.
-
From the picture it looks like the peak threshold value is only recorded above .3. I don'thave access to the code right now but I think there is a threshold setting in the program that you can lower.
-
thanks for chiming in. I don't feel so alone now and I am glad I kept this discussion public so others can follow. I did check with Michael and it looks like the Premium membership is valid it just seems to be taking a while to transfer the funds. Avinashgogineni, as mross has pointed out it would be a much easier for me and others to help you if you could answer the above questions. Ok as far as I can tell the current software does all of this. DO you agree that the software I wrote for you before does all the items above? I don't understand what you mean by "coincide" Please explain more what you mean by base line measurements OK so you would like a pull down menu I will add this to your main What does a uniform curve look like or how will we know what a uniform curve is. What do we do if a curve is not uniform? you will need to create an example excel sheet and how you want it formated. I'm not going to guess at this. Junk data will be left out of the excel sheet. Please answer all the questions with as much detail as you can. Mark