dadreamer
-
Posts
369 -
Joined
-
Last visited
-
Days Won
43
6 Followers


Recent Profile Visitors
10,262 profile views


dadreamer's Achievements
")


-
From what I can remember, for LV 5.0.x and older RTE (i.e., a loader plus small subset of resources) was included into the EXE automatically during the build process. For LV 5.1.x there was a choice: to include RTE into the build or to use an external RTE. And since LV 6.0 only an external RTE was supposed. I could say more, such a trick is still possible for all modern versions on all three platforms (Win, Mac, Linux). The latest version I tested it on, was LV 2018, but I'm pretty sure, the technique hasn't changed much. I can't remember, from which version NI started to use Visual Studio 2015, but since then each EXE requires The Universal CRT, that is contained in Microsoft Visual C++ 2015 Redistributable. One could install such a distro on a clean machine or copy all these files from the machine, where such a CRT is already installed. Now besides of those the application will also require this minimal subset of folders/files (true for LV 2018 64-bit): On Linux it goes much easier (true for LV 2014 64-bit): For LV 2018 64-bit with a "dark" RTE it also wants And for Mac OS you can embed RTE into the application with this script: Standalone LabVIEW-built Mac Application with Post-Build Action. Of course (and I'm sure everyone understands that), the technique described above, is applicable to very simple 'a la calculator' apps and not very to not at all for more or less complex projects. The more functions are called, the more dependencies you get. If something from MKL is used, you need lvanlys.dll and LV##0000_BLASLAPACK.dll, if VISA is used, you need visa32.dll, NiViAsrl.dll and maybe others, and so on and so forth.
-
I have LabVIEW 5 and 6 on my USB stick too and they both run OK on Windows 10. Initially LV 5 was hanging at the start, so I had to disable multithreading: ESys.StdNParallel=0 Not that I really need LabVIEW to be on hand all the time. But sometimes it's useful to have around an advanced calculator for quick-n-dirty prototyping. And sometimes to look at how things were then. Considering the age and bugs, using these versions for serious projects is, to put it mildly, unwise. I also don't like that LabVIEW re-registers file associations for itself every time it starts, but I'm more or less used to this. I also believe, those versions didn't really need some pirate tools. Just owner's personal data and serial number were needed. If not available, it was possible to use 'an infinite trial' mode: start, click OK and do everything you want.
-
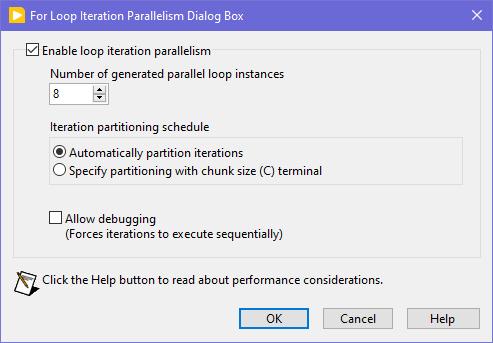
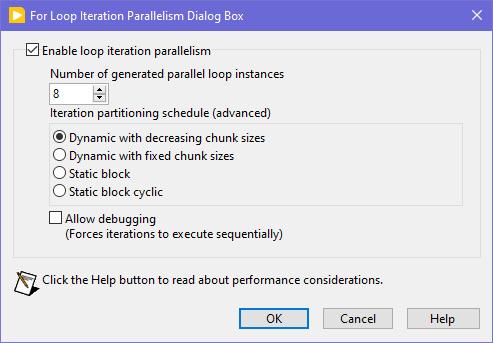
Seems like this one has "escaped everyone's grasp" too. ParallelLoop.ShowAllSchedules=True Because was only checked from the password-protected diagram of ParallelForLoopDialog.vi (LabVIEW 20xx\resource\dialog). Present since LabVIEW 2010. When activated, allows to apply more advanced iteration partitioning schedule. In other words, instead of this you will get this Сould this be useful? I can't say. Maybe in some very specific use-cases. In my quick tests I didn't manage to get increase in any productivity. It's easy to mess up with those options and make things worse, than by default. Also can be changed by this scripting counterpart.

-
 This is true. But! If the VI to open is a member of a lvclass or lvlib and the typedefs input is False (default value), then almost any subsequent action on that VI ref leads to the whole hierarchy loading into memory. This is not good in most cases as with large hierarchies loading takes several seconds and LabVIEW displays loading window during that, no matter which options are passed. The only easy way to escape that is to set the typedefs to True. Another option would be putting the VI in a bad (broken) state, but the function suitable for this is not exported. Frankly this Open.VI Without Refees method acts a bit odd, because when the typedefs is False, it sets the viBadVILibrary flag, but it does not give the desired effect, but when the typedefs is True, such a flag is not set, but no dependencies are loaded. Sometimes I use Open.VI Without Refees to scan VIs for some objects on their BD's / FP's and when there are thousands of VIs, it all takes many minutes to scan, even with the typedefs = True. I managed to speed things up 3-4 times by compiling my traversal VI and running it on a Full Featured RTE instead of a standard RTE to get the scripting working. Using that ~20 000 VIs are scanned in about 5 minutes.
 -
I haven't had much time to investigate this until this month, but I think I've found the cause. XNodes on the production computer were not designed optimally. In the AdaptToInputs ability I was unconditionally passing a GenerateCode reply, thinking that the AdaptToInputs is only called when interacting with the XNode (connecting/disconnecting wires). It turned out that LabVIEW also calls the AdaptToInputs ability once, when the VIs are loaded and any single change is made, no matter if it touches the XNode or not. As I had many such non-optimal XNodes in many places, it was causing code regeneration in all of them. Besides of that some of my VIs had very high code complexity (11 to 13), because of a bunch of nested structures. When the XNodes regeneration was occurring simultaneously with the VIs recompilation, it was taking that a minute or so. After I added extra conditions into my AdaptToInputs ability (issue a GenerateCode reply only, when the Term Types are changed), the edits in my VIs started to take 1.5 seconds. Still the hierarchy saves can be slow, when some 'heavy' VIs are changed, but it's a task for me to refactor those VIs, so their complexity could decrease to 10 or less. By the way, my example from the previous page was not suitable for demonstrating the situation, as its code complexity is low and the Match Regular Expression XNode does not issue a GenerateCode reply in the AdaptToInputs.
-
Sort (search) Array of cluster by one cluster element
dadreamer replied to Bobillier's topic in LabVIEW General
You want an ability to override the Equality or Comparison operators? I'm unsure, whether it really existed in OpenG packages, but now you have those neat malleable VIs, that let you do that: Search Unsorted 1D Array , Sort 1D Array , Search Sorted 1D Array. They have an additional input to specify your own equals or less function in a form of a custom comparison class or a VI refnum. There's an article to help: Creating a Custom Sorting Function in LabVIEW -
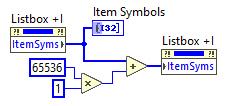
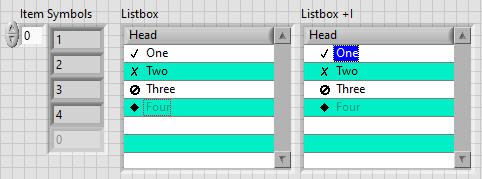
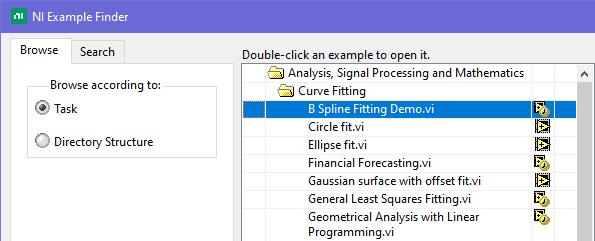
This is exactly what was said in that ancient thread: Tree control in labview. So if you add 65536*N to the Item Symbols property of the Listbox and have the "Enable Indentation" option activated, you shift the symbol/glyph and the text N levels to the right. Could be useful for simple 'parent-child' relationships, if you don't want to use a Tree. And still it's used in Find Examples / NI Example Finder window:
-
How to extract a circular ring from a Image?
dadreamer replied to Wang xiang yang002's topic in LabVIEW Community Edition
IMAQ Unwrap VI Example is at \LabVIEW 20xx\examples\Vision\Image Management\Unwrap Barcode.vi. For U16 images also see this: IMAQ Unwrap Example - not working properly with U16 image type? -
About a minute for a change, that's what I've seen on a production machine. On my home computer it's as on yours though: a single edit takes 1-2 seconds. I'm still investigating it. I will try different options such as enabling those ini keys or disabling the auto-save feature. To me it looks like the whole recompilation is triggered sometimes. By the way, there are more keys to fine-tune XNodes: I haven't yet figured out the details.
-
Looks like Block Diagram Binary Heap (BDHb) resource took 1.21 MB and the rest is for the others. There are 120 Match Regular Expression XNodes on the diagram. If each XNode instance is 10 KB approximately, and they all are get embedded into the VI, we get 10 * 120 = 1200 KB. The XNode's icon is copied many times as well (DSIM fork). So, the conclusion is that we shouldn't use XNodes for multiple parallel calls. The less, the better, right? Ok. The load time seems to reduce with these tokens: Still the editing is sluggish tho.
-
4. WinAPI version using ChooseColor function. NativeColors.rar Far from ideal, don't kick too hard. 🙂 Determine Clicked Array Element Index is from here.
-
Well, I see no issues when running XNodes at the run-time, when everything is generated and compiled. What I see is some noticeable lags at the edit time. Say, I have 50 or even 100 instances of one or two XNodes in one VI, set to their own parameters each. When compiled, all is fine. But when I make some minor change (create a constant, for example), LabVIEW starts to regenerate code for all the XNodes in that VI. And it can take a minute or so! Even on a top-notch computer with NVMe SSD and loads of RAM. Anyone experienced this? I've never seen such a behaviour, when dealing with VIM's. Tried to reproduce this with a bunch of Match Regular Expression XNodes in a single VI. Not on such a large scale, but the issue remains. Moreover the whole VI hierarchy opens super slowly, but this I've already noticed before, when dealt with third party XNodes. xn.vi
-
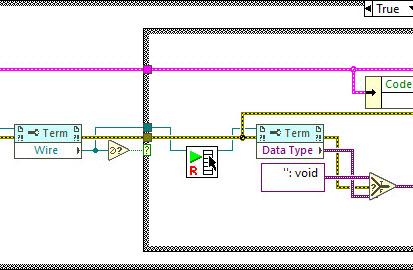
I kind of liked this idea and wished VIM's could allow for such a backpropagation. Even had a thought of making an idea on the dark forums. But then I played a while with the Variant To Data node. It doesn't play well. It can't determine a sink, if a polymorphic VI is connected or even when a LV native (yellow) node is connected. Borders of structures are another issue, obviously. So, it'd require making two ideas at least: to implement VIM backpropagation and to enhance the Variant To Data node. (As a hack one could eliminate the Variant to Data in their code with coerceFromVariant=TRUE token, but then the diagram starts to look odd and no error handling is performed). If someone still wants the code, shown in the very first post, it's here: https://code.google.com/archive/p/party-licht-steuerung/source/default/source?page=3 (\trunk\PLS-Code\PLS Main.vi). And these are the papers to progress through the lessons: LabVIEW Intermediate I Successful Development Practices Course Manual. Nothing interesting there for an experienced LV'er though. XNodes demonstrated here work a way better, and could be a good alternative (if you're OK with unsupported features, of course). As I tried to adapt them for my own purposes, I decided to improve the sink search technique. It surprised me a bit, that there's still no complete code to walk through all the nested structures to determine a source/sink by its wire. Maybe I didn't search well but all I found was this popup plugin: Find Wire Source.llb. It stops on Case structures though. I have reversed its logic to search for a sink instead of a source and tried to apply recursion, when it encounters a Case structure. Well, it's still not ideal, but now it works in most my cases. There are some cases, when it cannot find a sink, e.g. wire branches with void terms: Too many scenarios to process them all. Nevertheless, this little VI might be useful for someone. You may use it as a popup plugin, of course, or may pull out that Execute Find Wire Destination (R).vi and use it in your XNodes. As an example: Find Wire Destination.llb Already tried such nodes in a work project. I must admit that not all the time back-propagation is suitable, so about 50/50. But when it's used, it works.
-
Find most recently created or modified image(file)
dadreamer replied to mooner's topic in LabVIEW General
In addition to the LV native method, there are options with .NET and command prompt: Get Recently Modified Files. -
LabVIEW Build Array Bug #1: Unexpected Array Growth
dadreamer replied to Joel Foster's topic in LabVIEW Bugs
I remember I even had an idea, that would make it easier to track such situations: Add Array Size(s) Indicator. In design time it would cost almost nothing. Although I admit, its use cases are quite rare.